Today we want to give you a small preview of an upcoming XLT feature. Most of you probably know that XLT features agent statistics. These statistics help you to keep an eye on the health of the test execution engines (agents) to ensure that you do not influence the test results by providing insufficient hardware or by applying no or incorrect settings.
Most modern programming languages are virtual machine based and these machines have knobs you can turn to adjust their behavior according to your requirements. XLT runs on Java and so all the things you might have already learnt from tuning your Java-based servers apply to XLT as well. If you do not have experience in tuning your Java-based servers, you will learn a lot that can be applied to your servers and help you to increase performance.
So, let’s take a look at the upcoming XLT feature that provides you with more details about garbage collection (GC) without the need to use any external tool to monitor or analyze logs or JVMs runtime behavior.

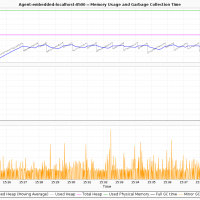
This is a chart displays nice memory statistics that indicate absolutely no problems with the garbage collection. As you can see the memory usage (first chart in the image) is alternating but never touching the upper limit. The second chart gives you the times when full garbage collection occurred, basically these are the bad events. Events that block the virtual machine from continuing to run. We should avoid these at any cost… nearly, because a full GC is costly. There was only one full GC right at the beginning at the test. This is a normal JVM behavior. So we seem to have done a pretty good job. No major collection of garbage. Sweat!
There are still the minor collections. Minor collections occur frequently and they reclaim small portions of memory with short living objects. The third charts shows us, that minor collection took about 10 to 30 ms, some spikes up to 70 ms. This is acceptable.

Ok, let’s have a bad example in comparison. It runs with almost default VM settings. This means just min and max heap were set (Xms256MB/Xmx512MB). You can see clearly that a lot of major collections were running for up to 800 ms each. Also the minor collections were longer.
Clearly, the new charts help you see and fix misbehavior quickly. “What about the settings?” you might ask now. Yes, this example is not very helpful without revealing the difference between both test runs. So, we will give you the settings of the good one. The bad run had only Xms and Xmx set, as mentioned before.
|
1 2 3 4 5 6 7 8 9 10 11 12 13 14 |
## Set minimum memory to use -Xms512m ## Set maximum permitted memory -Xmx512m ## Enable concurrent old GC to avoid sudden long pauses -XX:+UseConcMarkSweepGC ## When to start GC for the tenured/old area of the memory. ## This has to be low enough to avoid that threads need ## memory and can not get any before the GC has finished. ## This will lower the wait time. -XX:CMSInitiatingOccupancyFraction=70 |
That’s really all. The use of the Concurrent-Mark-Sweep-Collector (CMS) is the most important setting. The CMS does not block the main VM worker threads, but collects the garbage concurrently. Because there might be situations were the CMS collector is not fast enough in cleaning up, this means the old space runs out of free memory, we give the CMS a hint with the last line. This line explicitly tells the CMS to start early with the clean up. In this case at a 70% fill level. The default is 96% and way too high.
One last thing. Setting Xms and Xmx to the same number helps the VM to relax because it will not try to get back to the minimal memory limit (Xms) and so it cleans less aggressively.
If you want to lean more about Java Garbage Collection, take a look at this Oracle documents: GC Tuning.