Tag Archives: Performance

Data Science Day 2022

After a two-year break, on 18 May 2022, the 4th Data Science Day Jena took place. The Friedrich-Schiller University is hosting this mini-conference format annually.

Xceptance presented this year a closer look at the data that is collected and processed during load and performance testing. René Schwietzke, Managing Director of Xceptance, talked about the challenges to capture the right data as well as translate the collected data into meaningful results. 

A load test simulates millions of user interactions with a website and therefore is capturing huge amounts of data points. These have to be transformed into a few numbers to make the result of the test easy to communicate but still preserve important details. The talk started with typical business requirements and expectations of the target groups of a load test. It showed the data XLT captures and the dimensions which later drive the data reduction. A few example data series demonstrated the challenges behind the data reduction and what numbers are finally used to satisfy the requirements.

An example load test result illustrated the talk with real data. That example test run created about 17,500 data rows per second which contain about 293,000 data points. The entire test result consists of 3.2 billion data points. This massive data set is turned into a consumable report by XLT in less than six minutes. 

For everyone with an interest in data science, this presentation also offers ideas for research in regard to unsolved data challenges. There might be even some Master’s and Bachelor’s theses topics waiting for you. 

You can find a recording of the presentation below (courtesy of Thüringer Universitäts- und Landesbibliothek Jena).

This is the accompanying slide deck. It is a Reveal.js-based. You can navigate with the spacebar and the arrow keys.

Picture of the presentation


iJUG-Magazin Java aktuell – Performance Tests of Microservices

Load and performance testing is not trivial. Load and performance testing microservices is even more challenging. Our article “Performance Tests of Microservices” in the iJUG-Magazin Java aktuell talks about approach and challenges when designing and executing performance test for microservices. So get yourself the Java Aktuell or, if you just want to check out the article, use this link to the PDF and enjoy. The article is in German.

A software architecture that consists of small independent components, is easier to create and to maintain. As a result of that, microservices have turned into a dominating topic in terms of modern software development. While the complexity on the development site is decreasing, topics like architecture, performance, such as the planning of performance tests and reliability issues of microservices are getting more attention. This article discusses the performance requirements and performance test planning of microservices.

Comments are very welcome.

iJUG-Magazin Java aktuell – High Performance Java

Java Aktuell Cover Issue 2/2020
Java aktuell 2/2020

After our presentation at the JUG Saxony Day in 2019, we have been asked to turn the talk into an article for the iJUG-Magazin Java aktuell. The February 2020 issue just got published and features this article. So get yourself the latest Java Aktuell or, if you just want to check out the article, use this link to the PDF and enjoy. The article is in German.

The days where Java was considered a slow bytecode interpreter have ended a long time ago. JVM is using many tricks in order to execute a code efficiently and to transform and optimize a Java code on the used hardware. With some knowledge about these processes, you can avoid working against the JVM system, while achieving more speed. Even if you are not chasing every last microsecond, it is still interesting to see what methods and techniques JVM uses for a better understanding of the runtime environment.

Comments are very welcome.

Comparing Measured and Perceived Loading Times

TL;DR: The perceived loading time is what shapes the user’s impression of the speed of a website, but measuring perceived loading time is difficult. There are technical loading times available but it is not clear if these times can be used in any meaningful way. This master’s thesis verified whether the perceived loading time can be easily correlated with any technical loading time, such as FirstPaint for instance. The result shows that a page with a fast loading time from a technical point of view is not necessarily perceived as fast by the user and vice versa. Therefore it is not sufficient to rely only on technical measurements and disregard the user’s perception.

Client-side performance is a big deal. There are various studies on the relationship between loading time and critical success factors such as usability of online shops, customer loyalty and sales. Yet a page with an objectively long total loading time could still be perceived as fast by the user, as the visible part of the browser window has already loaded and invites the shopper to interact with the page.

In her master’s thesis “Client-side performance: Comparison of measured and perceived loading times of online platforms in the B2C sector” Bastienne Sauter scientifically evaluated this discrepancy between the technically measured and the perceived loading times. By implementing automated tests with the automation tool XLT (Xceptance LoadTest), the loading times (timestamps recorded: domLoading, firstPaint, domInteractive, domContentLoadedEventStart, domContentLoadedEventEnd, domComplete, loadEventStart and loadEventEnd) of fifteen German e-commerce stores were measured over a longer period of time, both for desktop and mobile. For each store and timestamp, a ranking of the average loading times was calculated for each device.

In order to determine the empirical values for the perceived loading time, an interaction study with test groups of students and of Xceptance employees was conducted. Each group consisted of 25 persons, so a total of 50 people took part in the study. The participants had to open predefined pages of an online store and assess the loading impression. The user’s perception was evaluated using suitable scales. In this manner a score value was determined for each store among the two test groups. Each participant evaluated only three of the 15 stores in order to keep the effort manageable. In other words a store was covered by five test persons of each group (according to Nielsen and Landauer, a total of five respondents per store is sufficient for usability tests to be meaningful and to cover the majority of usability results). To ensure comparability of the results, the interaction study was conducted on the same devices and at the same location to avoid different bandwidths of the internet connection. Furthermore the test session for every person was set up in a way to avoid stress and create a normal daily usage situation.

Comparing the measured technical loading times with the perceived ones from the study, it showed that they differ clearly from each other, with no significant correlation.

To get an impression of which timestamp could be most relevant for the perceived loading time, the distances of the positions in the rankings were calculated. The smallest deviations for the desktop showed the timestamp domContentLoadedEventEnd, while the timestamp firstPaint could be most relevant for mobile devices.

Sum of the distances between the different positions in the rankings

As a conclusion, it is neither sufficient nor purposeful to consider only the technical measurements for the evaluation of the client-side performance, because the user’s perception deviates significantly from the technical measurement. This proved to be true both for informed insiders (represented by company employees) and also the uninformed public (represented by the students).

The results raise further research questions, especially how quality key figures for the perceived loading time can be recorded and contribute to the evaluation of online stores. In the literature, user-centered key figures such as FirstMeaningfulPaint are cited for this purpose. Whether these figures are in fact useful to represent the perceived loading time, however, is unclear and requires further investigation.

Illustration of Load Metrics by Google under CC-BY-3.0 

Concurrent Users – The Art of Calculation

Most of you probably know the term Concurrent User. In the context of load and performance testing, this metric is often claimed the measure of all things, accompanied by the mentioning of astronomically high numbers we can’t really verify and that sometimes are simply used as sales argument for overpriced software products.

Today’s article is meant to shed some light on the concurrent user metric and the misunderstandings and myths surrounding it. Since Xceptance focuses on the internet and e-commerce, illustrations and examples will mainly refer to webshops; keep in mind, though, that the topic isn’t restricted to the domain of e-commerce load testing. Feel free to comment below, whether affirmative or critical.

Let’s start with a couple of key terms to help you understand what we’re talking about:

  • Visit: In general, a visit occurs when you send a request to a server and, as a response, the website you requested is displayed. Has a duration starting with the first page view and ends with the last. Consists of one or more page views.
  • Session: Technical term for a visit, basically the technical picture underlying it. Visit and session are often used synonymously.
  • Page view or page impression: A single complete page delivered due to a request of an URL; in a world of Ajax, intermediate logical pages can be considered an impression or view. Can lead to further technical requests (HTML, CSS, Javascript, images etc.)
  • Request: Submission of a request to a server, in the case of web applications mostly via HTTP/HTTPS protocols. Requested content may be HTML, CSS, Javascript as well as images, videos, Flash, or Silverlight applications – HTTP can deliver almost everything.
  • Think time: Time period between two page views of a visit.
  • Scenario: The course of a visit in terms of a use case (for example, to search something, to order something, or both). Representation of test cases meant to be run as load tests.
  • Concurrent User: We don’t exactly know about them yet…

Load and Performance Test

A load test wants to reflect present load conditions or anticipated load conditions. In either case, it’s impossible for a load test to cover all eventualities and be economical at the same time. There’s a myriad of ways you can go to explore a webshop. Thus, you decide on the most typical ones at first and make a scenario out of them afterwards. Most of the time, we consider a scenario an isolated visit repeating the steps of the test case and thus using defined data (note that also random data is defined data).

Let’s assume three scenarios: a visitor that is just looking (Browsing), a visitor that puts products into the cart (Add2Cart), and a visitor that checks out as a guest and wants their ordered items to be shipped to an address (Order).

The users have to go through the following steps to completely cover the scenario:

Browsing user

  1. Homepage
  2. Select a catalogue
  3. Select a subcatalogue
  4. Select a product

Add2Cart user

  1. Browsing 1.-4.
  2. Put a product into the cart

Order user

  1. Add2Cart 1.-2.
  2. Proceed to checkout
  3. Enter an address
  4. Select a payment method
  5. Select a delivery type
  6. Place the order

The first challenge is choosing the content for the single actions, that is should we always go for the same product, the same catalogue, should the number of items or the size of the cart vary, etc. Only these three scenarios offer infinite possibilities of variation already. But let’s stick with the basic steps and the simple Browsing for now.

Concurrent Users

When testing against a server, the single running of Browsing would be a visit consisting of 4 page views and possibly further requests for static content. A second execution of the test with all data and connections (cookies, HTTP-keep-alive, and browser cache) having been reset would result in another visit. If you now run these two visits simultaneously and independently from one another, you end up with two concurrent users. Note that the notion “user” is actually not the exact right term as we’re talking about concurrent visits here. We prefer the term visit in this context and the person performing it is the visitor.

Both of our visitors execute 4 page views each, thus resulting in a total of 8 page views. As each page view has a runtime on the server, let’s say 1 sec, one visit takes at least 4 sec. Therefore, if one user repeats their visits for one hour, he or she completes 3,600 seconds / (4 seconds per visit) = 900 visits / hour. Two concurrent visitors result in 1,800 visits in total leading to an overall total of 1,800 visits x (4 page views per visit) = 7,200 page views.

We just said “if one user repeats”. Of course, a single user would never repeat a visit that many times. Just look at the user here as the load test execution engine repeating that independently of other “users”.

Think times

Now, the majority of users isn’t that fast, of course, which is why usually think times get included. The average think time currently amounts to something between 10-20 seconds, depending on the web presence. It used to be 40 seconds but today’s users are more experienced and user guidance has improved a lot so that they can navigate through a website much faster. Let’s assume a think time of 15 sec for our example.

A visit would now take (4 page views each takes 1 sec) + (3 think times each 15 sec). It’s only 3 think times because there’s none after the last click that terminates the visit. Accordingly, our visit duration is 49 sec. If we now have a visitor repeat that for an hour, we’ll end up with a user completing 3,600 sec / (49 sec per visit) = 73.5 visits per hour.

If we want to test 1,800 visits again, we need 1,800 visits / (73.5 visits per hour per user) = 24.5 users, about 25. The number of page views stays the same since 1 visit equals 4 page views and the number of visits is constant. These 25 users need to complete their visits simultaneously and in parallel but still independent of one another.

Any Number of Concurrent Users is Possible

We now have 25 concurrent users that produce the exact same traffic simulation as 2 users without a think time. The exact same traffic? No, of course not – this is where extreme parallelism and the unpredictability of both testing and reality comes into play.

If the requirement was the simulation of 1,800 visits per hour and 7,200 page views per hour, we could now randomly pick a think time and by doing so, determine any number of concurrent visits aka users between 2 and x. With respect to our simulation period of 1 hour, we get a new session (begin of a visit) every two seconds on the server side – 3,600 sec / 1,800 visits as our visits are equally distributed.

You can also question the numbers by approaching the problem from another perspective: if 100 users are simultaneously active, then they can simultaneously request 100 page views. In the worst case (note that 1 page view takes 1 sec on the server side), however, this would amount to 100 * 3,600 sec = 36,000 page views per hour. Since the requirement of 100 concurrent users is actually never bound to a certain period, you therefore have to assume that these users could potentially click at any time.

From this point of view, you’ll soon realize that the number of concurrent users can basically mean anything: much traffic, little traffic, little load, much load. Only by knowing the test cases and additional numbers such as visits and page views per time unit can you a) define a number of concurrent users and b) check each number by means of calculation against the other numbers.

Oh, and needless to say that 42 is always a good number of concurrent users… ;-)

Why 100,000 Concurrent Users Aren’t 100,000 Visits

What we want to emphasize here is that a temporal dimension is absolutely necessary. The requirement of 300,000 users would always imply they could click simultaneously which would produce 300,000 visits at one blow. Now, you may want to argue that they aren’t coming simultaneously. However, if the users aren’t simultaneously active aka started a visit, they aren’t concurrent users anymore and then you don’t need to simulate them in the first place.

Provided an equal distribution and an average visit duration of 49 sec, 300,000 users per hour that are often identified with visits (business-wise) in most cases, would result in the following: a user completes 3,600 / 49 sec visit duration = 73.5 visits per hour so that you end up with 300,000 / 73.5 = 4,081 concurrent visits aka real concurrent users at any given second. 4,081 concurrent visits produce 4 page views in 49 sec (visit duration) each, that is in 49 sec we have 16,324 page views, thus 333 page views per sec (see next paragraph).

In terms of page views without think times this means: 300,000 users are 1,200,000 page views (for our example above). Thus, you need to complete 1,200,000 page views / 3,600 seconds = 333 page views per second. Without any think time you would therefore need 333 users for the simulation.

Regarding the final result, the simulation of 4,081 users and 15 sec think time therefore equals the simulation of 333 users without think time. On the server side, both will result in the identical number of visits per time period, the identical number of page views, etc.

That’s impossible…

You may raise some objections to this and they are actually valid since, in reality, the think time would never be exactly 15 sec and the response time would never always be 1 sec. This is where coincidence comes into play. With respect to our example, let’s assume the think time to vary between 10 and 20 sec. The arithmetic mean would still be 15 sec.

What happens now results in the following calculation: In the worst case, the duration of all visits is only 4 sec + 3 * 10 sec = 34 sec. With 34 sec, our server now has to deliver as many visits and page views as it delivered within 49 sec before. Thus, our test wouldn’t cover 300,000 users with 4,081 concurrent test users but 3,600 / 34 * 4,081 = 432.105 visits per hour.

That means you need to define target numbers you want to support, or measure what the server is currently able to deliver. As soon as you say you have a number of x visits that could vary in their duration, you end up with a higher maximum number of visits you need to support but that you actually don’t want to test.

Note that our sole focus is set on the load and performance test here. You want to know if you can cope with the traffic x where you assume x to be a constant worst case that applies to a longer period of time. If you want to measure the server side beyond the maximum “good” case, you don’t aim at the performance anymore but at the overload behavior. Then you focus on stability and a predictable way of “decline”. All tests that are normally run at first, which is absolutely correct, are tests that want to identify or verify the good case.

But still…

Of course, it can make sense to test 4,081 users instead of 333 although there’s the same number of visits and page views per time period on the server side. 4,081 users can be concurrent users for a very short time and claim, for example, 4,081 webserver threads or sockets, while 333 users will never reach this number. Even if you keep the think time for 4,081 users at a constant level, the traffic wouldn’t be as synchronous as you planned it to be in the beginning.

In the worst case, you can’t test at all now because each test run leads to a different result. With the restriction to 333 users with none or just minimal think time, you restrict the “movement” of the system at first to measure it. If the system delivers what it should, the test may expand in its width aka both the think times and the number of concurrent users go up.

Steady Load Vs. Constant Arrival Rate

To resolve this dilemma a) without having to consider the server side while b) still being able to measure accurately, you can choose between two typical load profiles:

  • Steady Load: Runs a fixed number of users that wait for the server, for instance, when it has long response times. This way you can’t reach the desired number of visits because users depend on the server’s response behavior. The profile is suitable for controlled measurements.
  • Constant Arrival Rate: Users arrive as new visitors regardless of what is happening on the server side. When the server is too slow, new users will still try to come in. If the server can handle the load, the system runs stable and you just need your user number x (according to our calculation, 4,081, for example). If there are problems on the server side, then the user number automatically increases to x + n (for example, to a total of 10,000 users). In the ideal case, that means you only need 4,081 users but when the server behaves unexpectedly, up to 10,000 users will be activated. This way you can also test the overload behavior at the same time.

Finally…

We hope you were able to follow and that the mess of numbers didn’t get too bad. At times, the concurrent user topic is getting downright absurd… Feel free to comment, any remark is appreciated.

Nice Reading: GitHub’s CSS Performance

GitHub CSS Performance, Title Slide

Another must read for the performance-aware programmer and tester. A nice slide deck about CSS performance issues at GitHub. Includes solutions as well.

A talk on some problems solved related to CSS Performance at GitHub. The talk was given at CSS Dev Conference in Honolulu, HI 2012. I recorded the presentation from my laptop and posted it here https://vimeo.com/54990931

Enjoy and keep in mind that performance matters.

How fast are we going now?

Steve Souders summarizes his HTML5 Developer Conference keynote in a nice blog post.

I enjoy evangelizing web performance because I enjoy things that are fast (and efficient). Apparently, I’m not the only one. …

… Vendors are pitching a faster web. Consumers are expecting a faster web. Businesses succeed with a faster web. But is the Web getting faster? Let’s take a look.

So hop over and keep reading: How fast are we going now?

Blog Performance – We Kicked it up a Notch

Usually, we just  measure the performance of our customer’s applications and talk about it, but from time to time we have to set an example ourselves.

In the last couple of weeks, we increasingly felt that our blog isn’t loading fast enough to deliver a satisfying experience. You know that when you can feel it, it might be too late already. Additionally, SEO is about content and performance and our blog is an important marketing tool for us.

That’s why we went on a quest for improving the performance of our company’s WordPress-based blog. Our motto: “Don’t just complain about the lack of performance, do something about it!”

Step 0 – Measuring

Our initial blog performanceMeasuring is believing and so we started with this WebPageTest result. As you can see, the initial performance is bad, a lot of content is not properly cached, and rendering started after 2.6 sec. Time for some serious tuning.

Step 1 – Reading

Tuning requires you to know what to tune. Thus, we read the famous Best Practises for Speeding Up Your Web Site by Yahoo. A similar article by Google can be found here. If you deal with web site performance in any way, you should read this. We consider it mandatory for performance and web testers.

Continue reading Blog Performance – We Kicked it up a Notch

The Art of Reading Performance Test Charts

Powerful load and performance test tools don’t only retrieve pages of your website randomly with zillions of users at the same time, but they also cover realistic scenarios simulating the real-world user. It’s a given that they can deliver lots of useful information and plot interesting charts. To fully take advantage of these benefits, however, you need to be able to interpret this information and draw the right conclusions.

It is this need for the correct interpretation of test results, the mapping of all you see against actual application behavior that makes performance and load testing a non-trivial task. It requires much experience to decide on the right actions, make the right assumptions, or simply come up with a reasonable explanation of why something happened this way and not the other.

In today’s article, we’d like to present you a couple of charts displaying typical response time patterns, and discuss what they could indicate.

Disclaimer: Of course, the reasons for a certain behavior vary a lot, depending on your application and testing. However, as there’s no fixed manual for the interpretation of load testing charts, we want to provide you with a couple of basic guidelines to help you get better in interpreting them yourself and make the most out of your test results. Feel free to comment whether or not you agree with the ideas and explanations we come up with.

The Warm-up

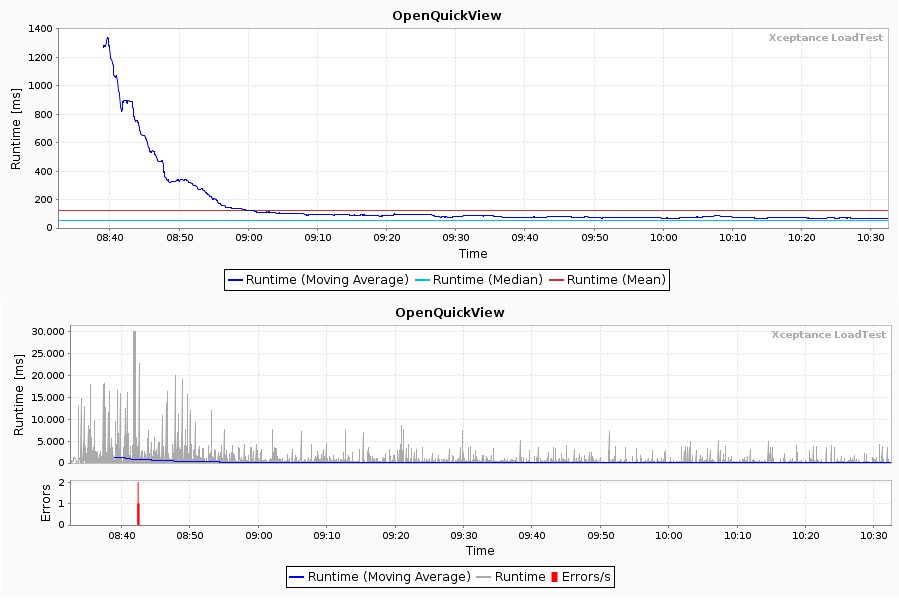
These charts might indicate a system with a cold cache, for instance, when the system has just been started and the caches aren’t filled yet.

The basic characteristics of such a behavior are high response times in the beginning, followed by gradually lower response times until eventually a  certain degree of runtime stability is reached. This time frame is often referred to as the system’s warm-up period. Throughout this period, a couple of things can happen under the surface. If you know the system under test well, you’ll probably come up with the following: database and file system caches are filled, proxies learn about the data and store them, the system under test scales up because it sees traffic, page snippets are cached and so the computing overhead reduces… you name it.

Also keep in mind that it might be the testing process itself that causes such a response time profile. If the system is perfectly warmed up and you hit it, your sent traffic might be too uniform in the beginning. That being the case, randomization kicks in so that the traffic eventually distributes better over time. Furthermore, take into consideration that your load software and hardware are possibly not warmed up either.

The Caching

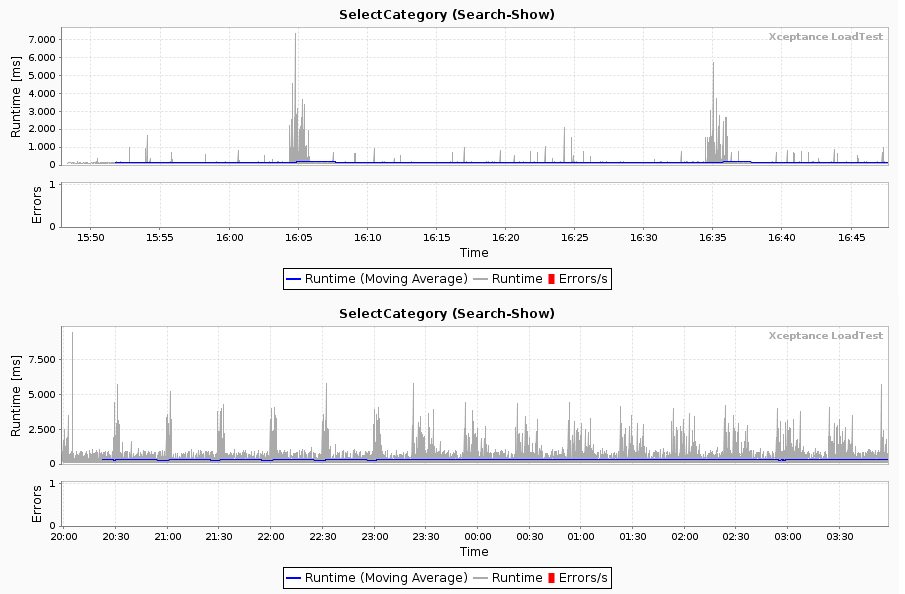
These charts depict either a typical cache clean or job patterns. In case of a cache clean, system-internal caches expire every half hour. If that’s not the case, the charts may indicate  a running background job draining power from the database or consuming lots of system bandwidth.

Both charts display the same test; however, this test has been executed for different time periods. While two spikes could signify a random event (despite the fact that the temporal distance of 30 minutes is suspicious), the longer test run seems to prove our first assumption: something is going on every half hour.

In any case, make sure that such a behavior is not produced by the test machines themselves, for example, because they’re busy writing or backing up data.

The Spiking

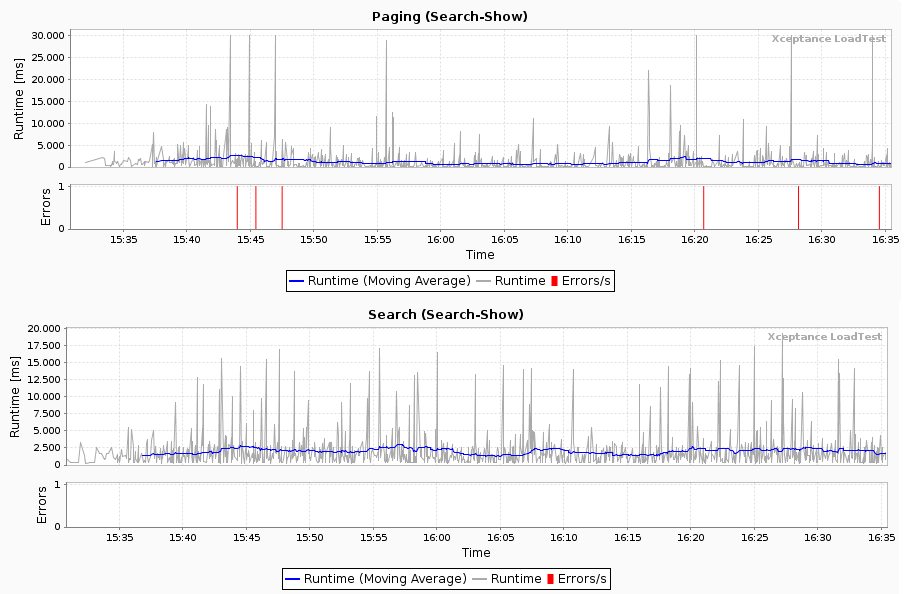
This is what we call a forest of spikes: many spikes that don’t seem to follow a comprehensible pattern; longer runtimes just occur occasionally, often caused by requests accessing certain data or URLs that produce long runtimes. To get behind that mystery, you have to dig into the results in more detail, find the calls behind the spikes, and derive a pattern based on the information you find. Often you’ll come across similar URLs, request parameters, or maybe response codes. Don’t forget any application logs you might have access to, such as web server, error, information, or debug logs. In a perfect world, your application under test offers the necessary tools to get to the bottom of this problem.

XLT lets you easily find this information. All test result data are accessible as CSV files that are quickly readable and documented. Feel free to work with this information and go beyond the scope of the reports available.

The worst outcome here is a non-identifiable pattern and no information on the server side as to what might have happened. In such a case, you have to repeat the test and narrow down your test setup later on to exclude as many variables as possible to find the cause. This is actually also a good time to ask for development or tech-ops support.

The 3rd-party Calls

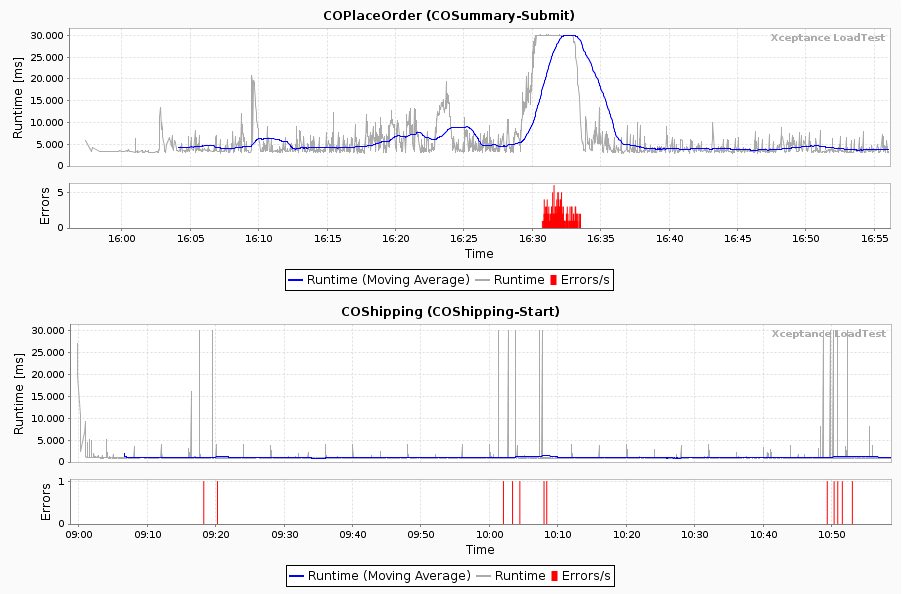
The first chart is typical for issues with 3rd parties, especially in the field of e-commerce. We’re not talking about direct calls to 3rd parties here, such as analytics vendors or recommendation engines, but calls from one server to the other. Thus, the response time we see is the response time of two systems. Of course, it’s good to know the area where 3rd party calls typically happen, but you have to know the application under test anyway to test it efficiently. So when the final order steps start to act weird, you can easily narrow down the potential reasons.

The second chart looks more like the cache clean or expiration problem described above, but since you know the application, you also know that this area doesn’t use the typical caching logic but is highly dynamic instead. This means that the errors occurring every 50 minutes point into a different direction: as we know that 3rd parties are attached and called during shipping, we can conclude that the 3rd party failed on us.

Verdict

Knowing typical response time patterns helps you specify a certain problem so that you can give hints to the development or further shape the path of testing. If you can read charts and derive the right conclusions or at least know which questions you have to address, you’ll be ahead of the crowd. Be aware that knowledge on the system under test is very important – the production and measurement of a certain load doesn’t make much sense when you’re not able to actually interpret and explain what you’ve measured. Always remember: 42 is not a valid answer for everything. :)

Statistics, Facts and Figures: Web Performance on Black Friday and Cyber Monday

According to onvab.com CyberMonday 2012 was the biggest buying and spending day ever!

Whether you are a fan of facts and figures or find such data rather boring – statistics published on dzone.com are really interesting: http://css.dzone.com/articles/black-friday-cyber-monday-2012

Short Summary

  • Most of the shop seemed well prepared. Congratulations!
  • Big players like Amazon and Apple came in with good results and obviously did their homework.
  • Barnes & Noble should review their site really carefully: Up to 262 requests per page and about 10 seconds until a page was fully loaded – this upsets even patient customers.

Now imagine you run a retail site that doesn’t handle the increased traffic on such an important day. Without doubt this will bring revenue down big time, which leads to an upset CEO and rolling heads. Not to mention all the nasty comments on Twitter and Facebook.

But how to prepare for THE day?

Option 1

You could hire thousands of students (each of them owning a notebook, smartphone or tablet) and let them shop your site. If you want to repeat this scenario, you obviously have to pay them twice or three times or…

Option 2

You could automate common page flows using a good test automation tool and run load tests frequently, watch the trends, and really run your own BlackFriday before BlackFriday.

It´s up to you! Afraid we can’t help you with option 1…