
TL;DR: Load and performance testing produces a vast amount of data. This data has to be interpreted and communicated. Because not every interested party speaks the same language, Xceptance developed a performance test rating and grading system. It evaluates response time, stability, and predictability and transforms three factors into a simple and communicable form. While doing that, it does not compromise on quality. It has been successfully used in more than 400 projects.
The Challenge
Load and performance testing is a key activity for making an online business successful. It validates that traffic and conversion expectations can be fulfilled. This of course applies to all kinds of Internet-based applications. Basically, as soon as there are expectations in terms of stability and performance, a test is mandatory to validate these. Expectations are usually set as requirements by different organizational groups such as sales, product management, engineering, and development teams.
Every group has a different understanding when it comes to results, goals, and success criteria. Some might be more concerned with the business impact, others are looking for technical implications of design decisions, and some just want to improve performance.
The group that is tasked with the evaluation of the requirements is faced with a very wide range of success definitions. In addition, it has to explain its technical measurements to all participating parties so that each party easily understands the state of testing.
Engineers rather look for detailed metrics including but not limited to the system behavior under test, while business-centric stakeholders just expect a clear yes or no. But performance testing typically does not deliver a clear result.
How can one reach all target groups without causing too much extra work to cater to all individual needs?
The Rating System
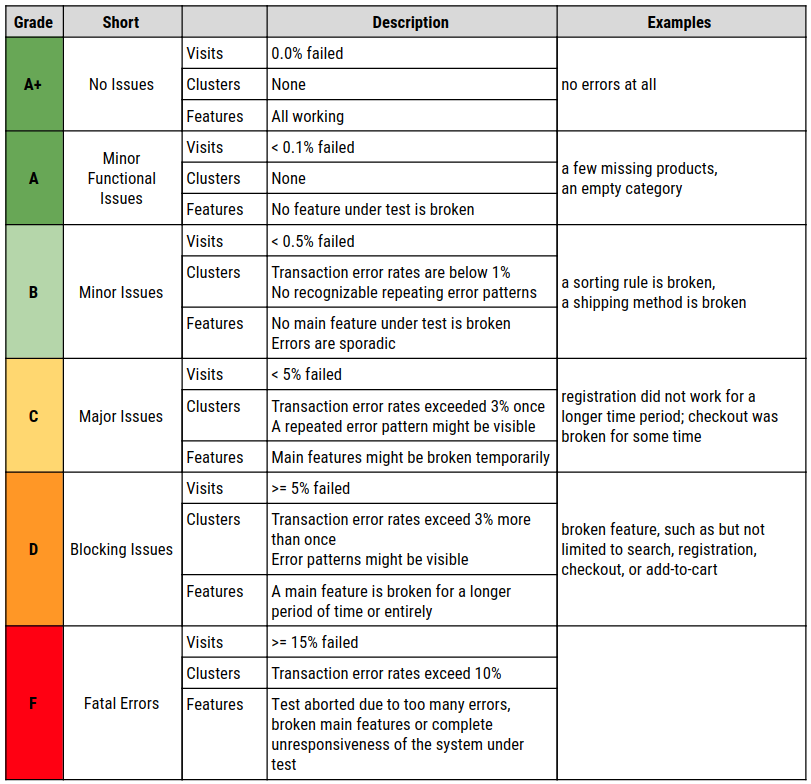
Xceptance developed a rating system that uses an American education system-like grading from A to F. The grades A to C symbolize a pass, while D and F are considered a fail. A grade B stands for an assumed average across similar customers and projects. It also stands for a good result. This leaves room in both directions to over or underperform.
Because performance results are not just shaped by response times, three factors are taken into account:
- Response Times
- Errors
- Predictability

Before continuing a detailed discussion of the factors, this table explains each grade in one sentence. For the more ambitious customers, the A+ stretch goal was added.
Let’s talk about our three factors in detail now.
Response Times
To clarify one thing first, this is about server-side performance. It does not take the client-side rendering including the loading of any content or JavaScript execution into account. For this, Google Web Vitals provide an excellent scoring system. In addition, when you evaluate API performance, you might want to refine your performance expectations.
A response time typically defines the time from initiating a request to a server until the full response has been returned to the requestor. It is likely the most used number to describe performance.
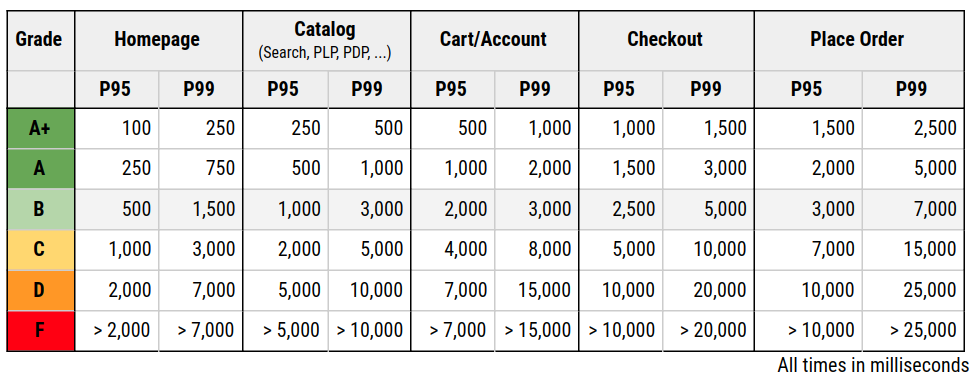
Server response times are validated using percentiles. This number indicates what response time a certain amount of users experience at maximum. For the response time grading, the P95 value is used. That means that 95% of requests have been finished within that time or faster.
One of the reasons for going with the P95 is that the user of provided infrastructure and software has often only limited influence on the behavior of the full stack. Hence there will be peaks and outliers which cannot be controlled nor diagnosed.
One can use the average, but it is a very imprecise number. It will either move too much or too little in regard to outliers. It just does not show what most of the users will truly see. An average user will never post something negative on social media, but the last 15% of the response time range will. So the rating cares more about the negative impression than the positive. This sadly ignores the last 5% and that is where projects become expensive. It is really hard to convince all stakeholders to use the P95 instead of the average, trying to establish the P99 or higher is nearly impossible.
The response times are grouped by activities because the user usually is more impatient at the beginning of its user journey. This data is based on years of measurements and ensures that goals are achievable but also ambitious enough. They all might heavily vary on your platform and stack. So these are not set in stone and these examples might only work for commerce.
Errors
The fastest response times are of no help if the response is incorrect. So correctness is key to performance testing. One might just say, every response code larger than 400 is a failure, but it is not that easy. Hence this factor distinguishes between two different types of errors: technical and functional errors.
Examples of functional errors are, not fully set up products, products that cannot be bought together, or an empty search result. If a response was not received or the response code indicates a problem, it is considered a technical error. Or in other words: If the user is properly notified about the problem, it is mostly a functional issue. If the state or messaging is undefined, it is mostly technical in origin.
A performance test has to ensure that technical errors are clearly highlighted because they might be caused by performance testing due to volume or scaling. Additionally, a performance test has to ensure functional correctness, because if the order cannot be placed and this is measured without validating the result, the test is just void.
To assign a grade to the error factor, this is verified:
- How many percent of the visits have been affected by an error?
- Do the errors occur in patterns or clusters?
- Are there any main features affected such as checkout or sign in?
Since barely any test run is error free when reaching a certain complexity, a low error rate might still be acceptable, even for an A rating.
The disadvantage of this approach is that errors become an accepted fact.
Predictability
In a perfect world, response times would be the same all day long. But that is impossible to achieve in a complex IT landscape, hence it is essential to minimize the noise. That is what this rating tries to capture. It introduces a predictability grade. Because the evaluation of noise is a complex process, Xceptance decided to retract to a metric anyone can grasp.
Predictability is defined by the business impact on the end user. It uses response times exceeding a certain value and the occurrence of technical errors (mainly non-recoverable errors such as response codes 500 or no response at all). This should give the merchant an idea of how many visits might have been affected by problems or slowness. Furthermore, being affected means that a visit carries the risk of a loss in revenue or reputation.

The threshold of 10 seconds is based on the user perception model published in the Google RAIL Model. This model applies to the total page loading time. The factor predictability uses the 10-second threshold for the runtime of a request. This makes it even softer than the value Google suggests, because the additional loading time of images, CSS, JavaScript is ignored.
Apart from the affected visits, this factor also considers response time patterns, increasing response time over time, and any sudden runtime changes.
To determine the grade these two questions are asked:
- How many visits are affected (see formula above)?
- Are there any patterns in response times such as increases, waves, or repeating spikes?
Summary
This rating system provides comparable and understandable results and caters to the needs of many stakeholders. Xceptance rolled it out to almost all load and performance tests and it proves to be effective and reliable. Some customers even arrive now with a goal of a certain rating to improve on the previous year’s results.
Xceptance has put that performance rating guide under the Creative Commons license – CC BY-SA 4.0. Feel free to use it for your everyday work, improve on it, and please let us know any feedback. We certainly appreciate it.
You can also use this slidedeck for communication and documentation purposes – https://training.xceptance.com/qa-and-test/050-performance-rating-system-devtest-leeds-2019.html.