TL;DR: Apple Pay doesn’t change how money moves; it just changes how card data is shared. Instead of transmitting real credit card numbers like a standard transaction, it passes a secure, device-specific token (DAN) that the card network resolves in the background. Because the underlying plumbing is the same, load testing actual payment gateways is unnecessary and introduces environment bottlenecks—testers should use latency-matched mocks instead.
In e-commerce, it’s a common misconception that digital wallets like Apple Pay entirely reinvent the payment lifecycle. In reality, Apple Pay utilizes the same foundational architecture as a standard credit card transaction.
Understanding the underlying mechanics of these flows is essential for any commerce tester—especially when it comes to security, routing, and performance testing.
The Core Terminology
- PSP (Payment Service Provider): Companies like Stripe, Adyen, or Cybersource that process transactions.
- TSP (Token Service Provider): The entity (often the card networks themselves) that maps secure tokens back to real card numbers.
- Card Network: Visa, Mastercard, AMEX, etc.
- Issuing Bank: Where the customer’s money or credit limit lives.
Apple Pay vs. Credit Card: What’s the Difference?
The fundamental payment behavior for Apple Pay and a standard credit card is identical. Both require a single outbound call to a PSP—either from the client browser (ensuring the merchant server never sees payment data) or from the server. The PSP responds with a transaction ID and status code.
Apple is never part of the payment transaction. Apple servers do not store or process your credit card numbers, and they do not route the money. Instead, the core differences lie in where the card data is stored, and how it is formatted.
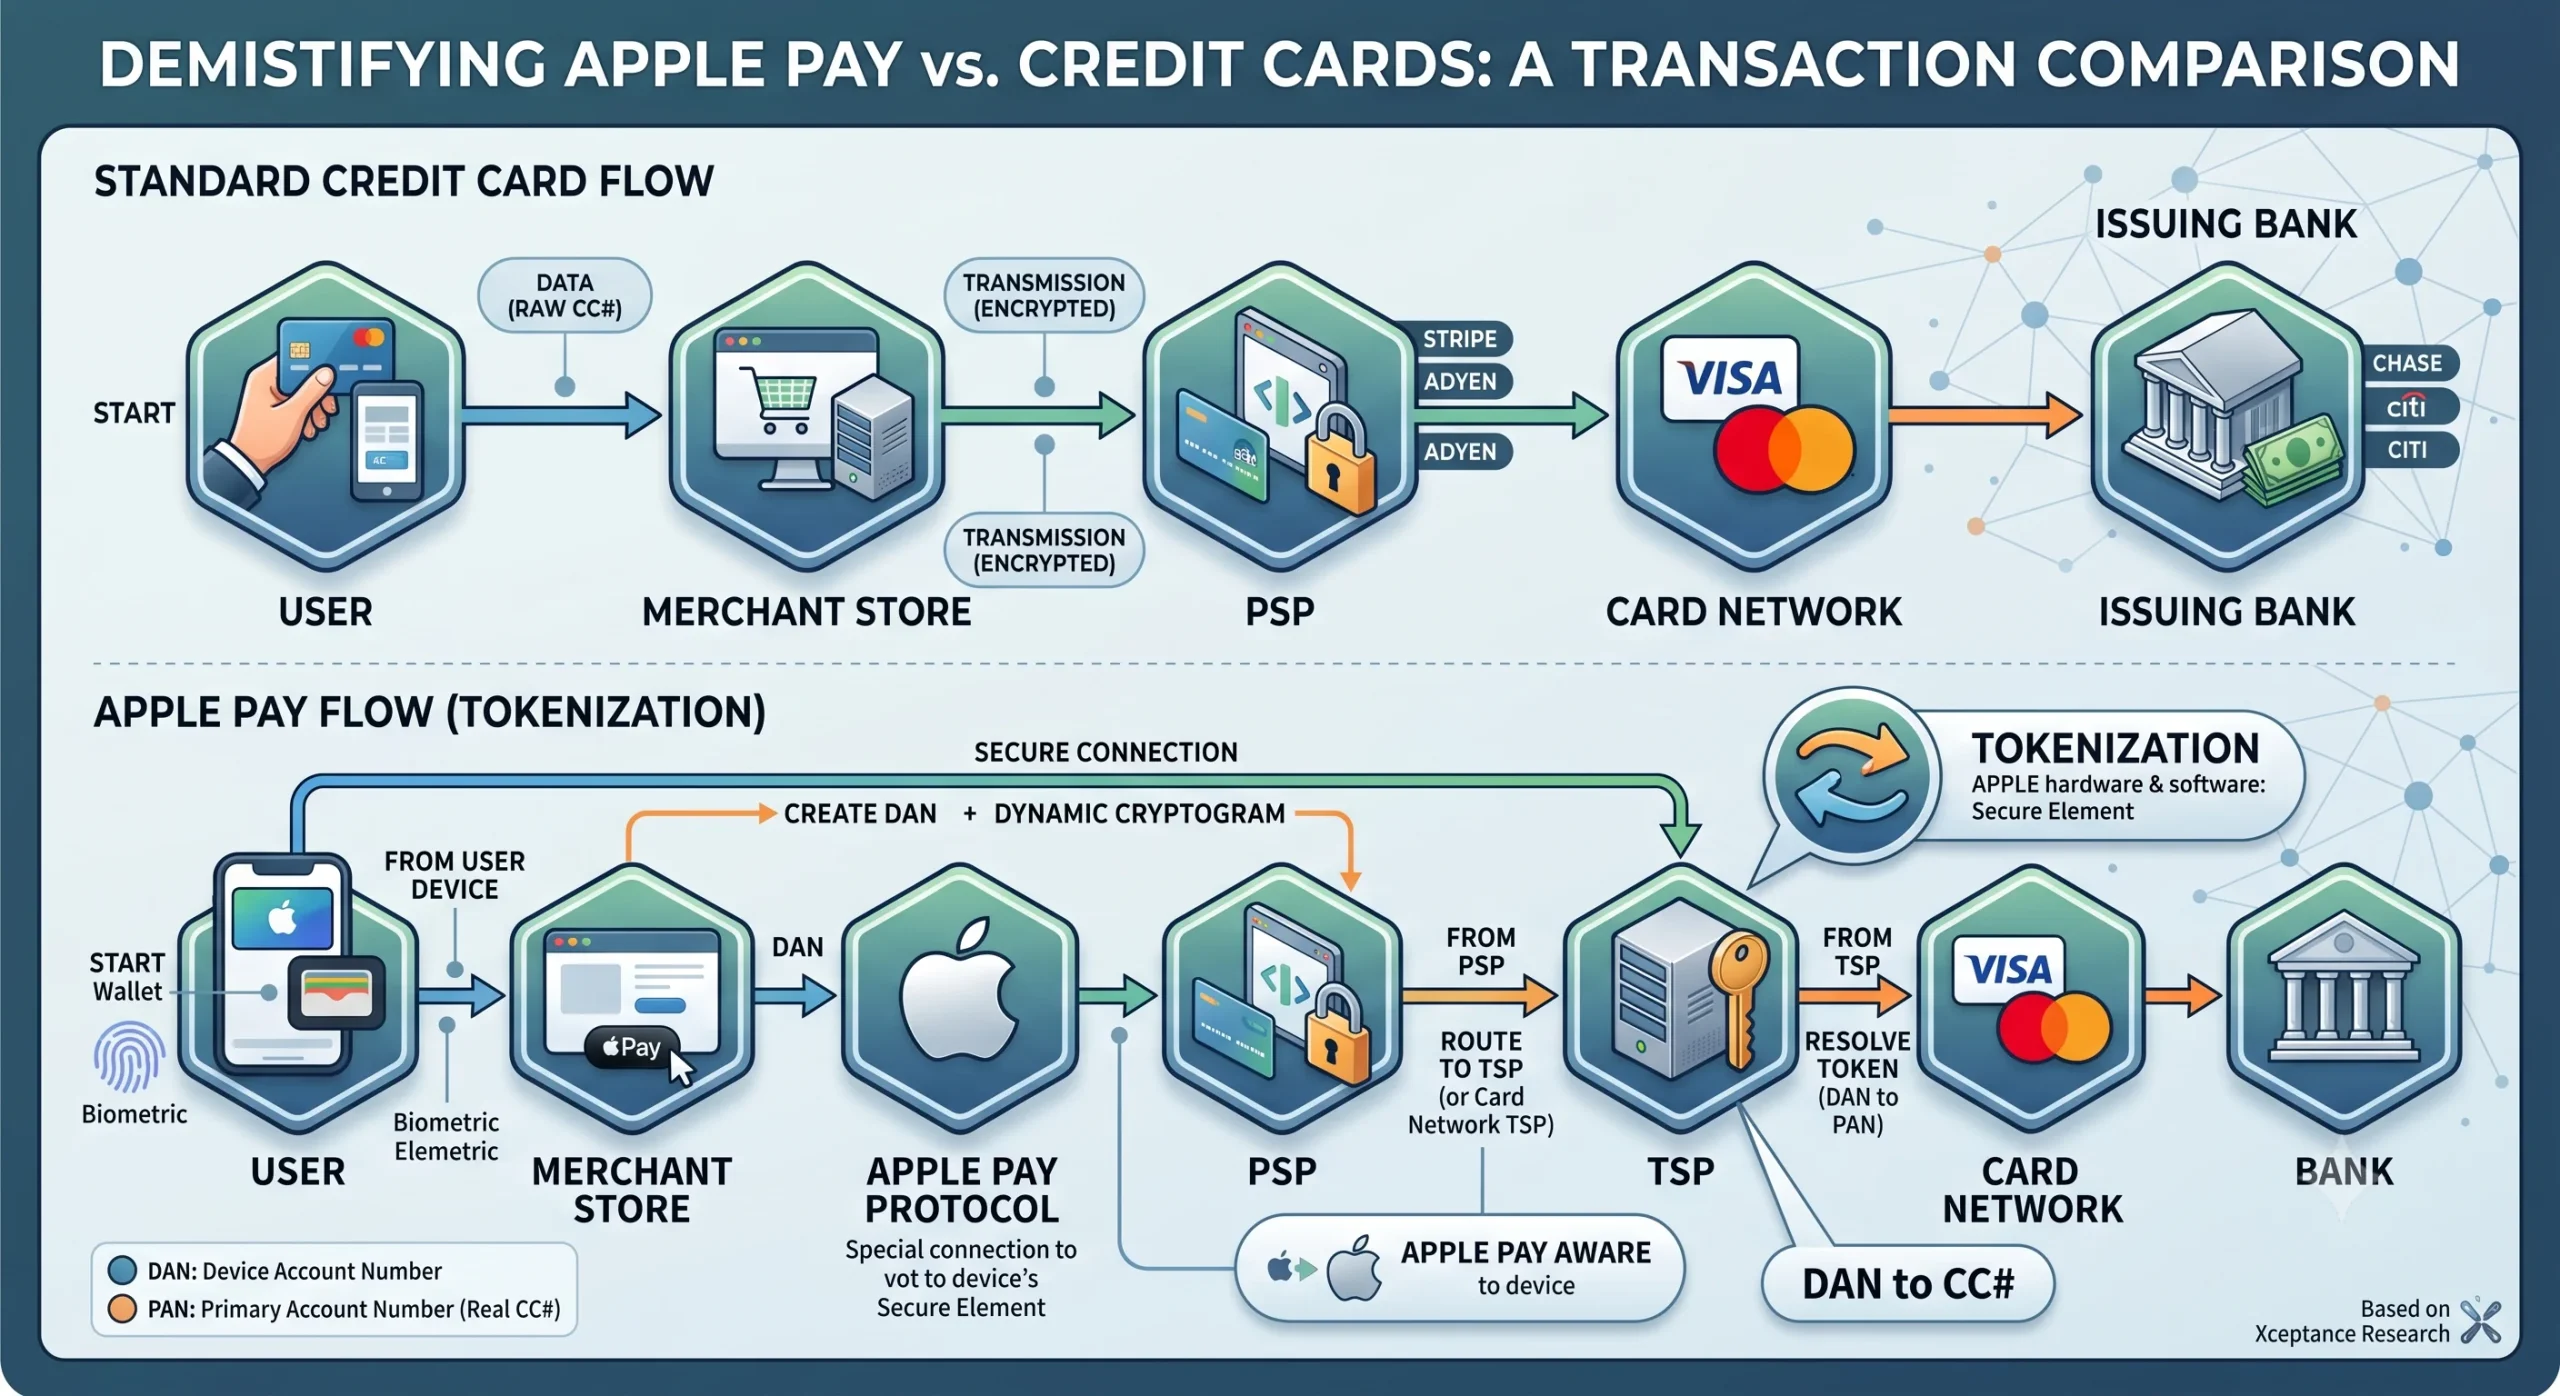
Standard CC: User ──> Merchant Store ──> PSP ──> Card Network ──> Bank

Apple Pay:   User ──> Merchant Store ──> PSP ──> Token Resolution ──> Card Network ──> Bank
1. The Standard Credit Card Flow
When a user enters a traditional credit card on a website, the actual Primary Account Number (PAN) is transmitted to the PSP. While modern setups encrypt this data or use merchant-side tokenization to prevent the store from saving raw card numbers, the real card data is still exposed during the initial transaction flow.
2. The Apple Pay Flow (Tokenization)
Apple Pay prioritizes convenience and security by hiding the real card data entirely:
- Provisioning: When a user adds a card to Apple Wallet, Apple sends the card details to a Token Service Provider (TSP). The TSP returns a unique Device Account Number (DAN).
- Storage: The DAN is stored locally in the Apple device’s isolated hardware—the Secure Element. Apple never uploads this to the cloud.
- Transaction: When paying via Safari, the browser extension securely passes the DAN and a one-time dynamic security cryptogram to the PSP.
- Resolution: The PSP routes the DAN to the card network, which resolves the token back into the actual credit card number to verify funds with the bank.
Note: Google Pay operates on this exact same structural logic.
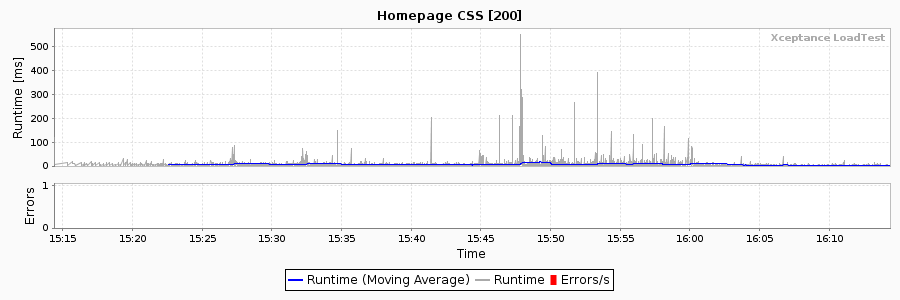
Why Performance Testing Payments is an Anti-Pattern
A frequent point of debate during holiday readiness (like Black Friday preparation) is how to load-test payment flows.
Simply put, you should never load-test a live payment provider.
When conducting performance tests, you should always mock the payment gateway or use the provider’s dedicated sandbox environment. Here is why:
- Different Architecture: Third-party test systems do not behave like production environments. Production systems communicate with global banking networks in the background; sandbox environments do not.
- Capacity Limits: Sandbox systems are frequently throttled, implement strict quotas, and run slower than production. Load-testing them will give you inaccurate performance metrics.
- The Scale Reality: Massive PSPs handle hundreds of thousands of merchants simultaneously. Your individual load test will not stress a production gateway. During real peak events like Black Friday, the payment providers are already scaled to handle global traffic. Testing your future traffic against them is unnecessary.
Summary for Testers
As commerce testers, focus your performance efforts on your own application’s checkout architecture, cart handling, and order creation. Leave the payment processor’s load management to them, and rest easy knowing that whether a user clicks “Pay with Card” or “Apple Pay,” the underlying financial plumbing remains securely the same.
For a load tester, using a mock is the best approach, provided it is configured to mimic the exact latency behavior of the original live call. Building a mock also significantly improves error-handling coverage. It allows you to easily simulate and test tricky edge cases on demand, such as gateway timeouts, bad requests, and connection failures.
Xceptance already has a large library of pre-built mocks ready to support load testing for a wide variety of third-party endpoints, including payment gateways.