All posts by Bastienne

Comparing Measured and Perceived Loading Times

TL;DR: The perceived loading time is what shapes the user’s impression of the speed of a website, but measuring perceived loading time is difficult. There are technical loading times available but it is not clear if these times can be used in any meaningful way. This master’s thesis verified whether the perceived loading time can be easily correlated with any technical loading time, such as FirstPaint for instance. The result shows that a page with a fast loading time from a technical point of view is not necessarily perceived as fast by the user and vice versa. Therefore it is not sufficient to rely only on technical measurements and disregard the user’s perception.

Client-side performance is a big deal. There are various studies on the relationship between loading time and critical success factors such as usability of online shops, customer loyalty and sales. Yet a page with an objectively long total loading time could still be perceived as fast by the user, as the visible part of the browser window has already loaded and invites the shopper to interact with the page.
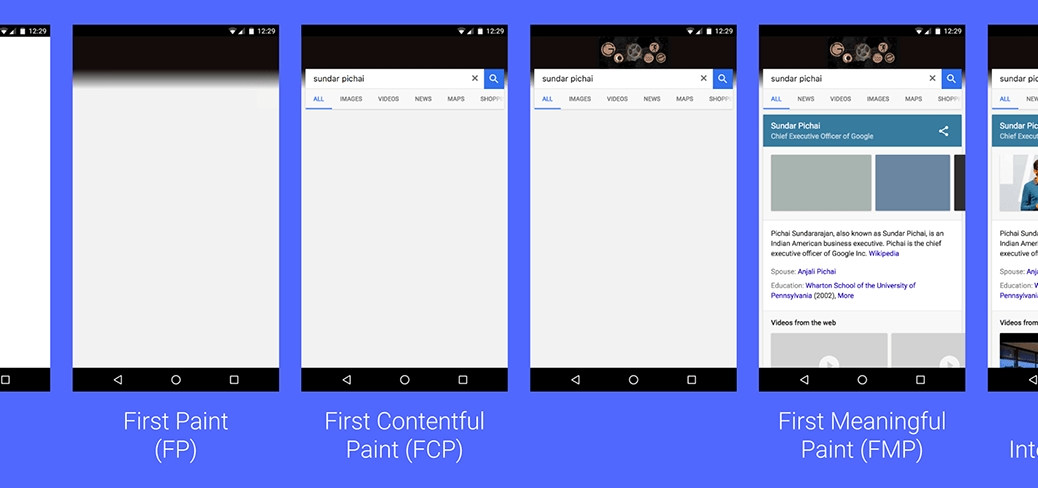
In her master’s thesis “Client-side performance: Comparison of measured and perceived loading times of online platforms in the B2C sector” Bastienne Sauter scientifically evaluated this discrepancy between the technically measured and the perceived loading times. By implementing automated tests with the automation tool XLT (Xceptance LoadTest), the loading times (timestamps recorded: domLoading, firstPaint, domInteractive, domContentLoadedEventStart, domContentLoadedEventEnd, domComplete, loadEventStart and loadEventEnd) of fifteen German e-commerce stores were measured over a longer period of time, both for desktop and mobile. For each store and timestamp, a ranking of the average loading times was calculated for each device.

In order to determine the empirical values for the perceived loading time, an interaction study with test groups of students and of Xceptance employees was conducted. Each group consisted of 25 persons, so a total of 50 people took part in the study. The participants had to open predefined pages of an online store and assess the loading impression. The user’s perception was evaluated using suitable scales. In this manner a score value was determined for each store among the two test groups. Each participant evaluated only three of the 15 stores in order to keep the effort manageable. In other words a store was covered by five test persons of each group (according to Nielsen and Landauer, a total of five respondents per store is sufficient for usability tests to be meaningful and to cover the majority of usability results). To ensure comparability of the results, the interaction study was conducted on the same devices and at the same location to avoid different bandwidths of the internet connection. Furthermore the test session for every person was set up in a way to avoid stress and create a normal daily usage situation.

Comparing the measured technical loading times with the perceived ones from the study, it showed that they differ clearly from each other, with no significant correlation.

To get an impression of which timestamp could be most relevant for the perceived loading time, the distances of the positions in the rankings were calculated. The smallest deviations for the desktop showed the timestamp domContentLoadedEventEnd, while the timestamp firstPaint could be most relevant for mobile devices.

Sum of the distances between the different positions in the rankings

As a conclusion, it is neither sufficient nor purposeful to consider only the technical measurements for the evaluation of the client-side performance, because the user’s perception deviates significantly from the technical measurement. This proved to be true both for informed insiders (represented by company employees) and also the uninformed public (represented by the students).

The results raise further research questions, especially how quality key figures for the perceived loading time can be recorded and contribute to the evaluation of online stores. In the literature, user-centered key figures such as FirstMeaningfulPaint are cited for this purpose. Whether these figures are in fact useful to represent the perceived loading time, however, is unclear and requires further investigation.

Illustration of Load Metrics by Google under CC-BY-3.0