Test Automation – Reports and Results

TL;DR: Test automation reporting is important for communication and decision-making. Best practices include consistent naming, using display names and tags, linking related data, providing clear error messages, adding environment information, categorizing reports with features and stories, visualizing data with screenshots and recordings, and including the test data used. These things improve traceability, debugging, and report readability for all report consumers.

Motivation

Comprehensive reporting is essential for effective test automation, facilitating clear communication among stakeholders. Managers need high-level summaries to make informed decisions, testers require detailed reports to pinpoint issues, and developers need technical reports for debugging. Good reporting also enables continuous improvement by identifying trends and measuring effectiveness.

With this guide, we want to share best practices when it comes to test automation reporting based on what we’ve learned over the years. As an example, we are going to use Neodymium, but keep in mind that all the following suggestions can be applied to other tools and approaches too.

The Basic Numbers

When viewing a report, an immediate overview should provide the total number of executed test cases, along with the counts for passed, failed, and skipped tests. This quickly confirms that all tests ran and offers an instant gauge of the test run’s success. A pie chart can be a useful way to visualize this data.

A dashboard-style image from a test automation report. It shows a pie chart with sections for 'Passed' (75%), 'Failed' (15%), and 'Skipped' (10%), indicating the test case counts and their success rate. Below the pie chart, there is a table showing the status of different test suites.
The total test case and failure count.

Good Naming

Repository

Good naming doesn’t start with test cases or methods; it starts when setting up the test automation project. Packages and classes should benefit from good naming before test cases even exist. The following package structure is just our way of handling naming. So keep in mind that there are other options; it’s just important to be consistent.

This is an example of a typical project filesystem structure with Neodymium.

Test Flow

An automatically generated test flow lacks logical steps and is often just a list of validations and interactions without any structure. That’s still better than no test flow at all, but if you want to properly organize it, you can use the @Step annotation provided by Allure or an equivalent. It is used to annotate methods to group their content and to give a fitting headline.


A snippet from a test automation report showing the "Test body" of a successful test. Each line represents a test step, with a green checkmark icon. The steps are: $("#search-field") val(jeans), $("#search-field") press enter(), $("#search-field-text-value") should be(visible), and $("#search-field-text-value") should have(exact text "jeans").
The test flow without steps.

A snippet from a test automation report showing the "Test body" of a test case organized with steps. The first step, "search for 'jeans'," is expanded to show its parameter, searchTerm, with the value jeans, and two sub-steps: $("#search-field") val(jeans) and $("#search-field") press enter(). The second step, "check the search results for 'jeans'," is also expanded, showing its parameter and two sub-steps that validate the search results. All steps and sub-steps have a green checkmark indicating they passed.
The test flow organized in steps.

To achieve this, you just have to add the @Step annotation with a proper description to every public method implemented in your test suite. If some methods have parameters, you can also add them.

Severities

When a test fails, the first thing you want to know is the severity of the error. But how do you achieve that? Keywords can be used to add a severity like “low”, “medium”, “high” and “blocker” to your test cases to define their importance and to help the reviewer prioritize accordingly.

See immediately that the issue is critical

Blocker test cases are the most important ones. If they fail, a business relevant functionality doesn’t work. For websites, for example, that would be the checkout process. If during checkout something goes wrong the issue should be reported and fixed with the highest priority to not miss out on any orders. Test cases annotated with the keyword low are least important. If they fail, a minor issue has occurred that is not limiting any functionality, like a typo on a documentation page, for example.

Another keyword, KnownIssue, lets the reviewer know that the test failed due to an error that is already known and currently being worked on but not fixed yet. That saves the reviewer the time to go through the test results to check what exactly went wrong.

See that this issue is known.

To add keywords to your test cases, you can use the @Tag annotation provided by JUnit. You can also use tags to simply add a list of the features tested, for example. Add as many tags as you want.

Data

Environment

Having all the environment information for a test run helps the reviewer understand the circumstances under which an error occurred. This includes, for example, the browser version, the environment under test, and perhaps even the version of the operating system used.

In Neodymium, we enabled the user to add as much environment information as needed to the report. Some information, such as the browser used, is added automatically.

Test Data

To properly reproduce an occurring error, the reviewer has to immediately find the used test data. So, we implemented a feature in Neodymium that adds a JSON view of the test data as an attachment to the corresponding test case in the report. Especially for non-technical users, that’s a huge time saver because there’s no need to find the used test data in the code itself.


A section of a test automation report showing a test step labeled "open home page flow" with 4 sub-steps, which took 4.309 seconds to execute. Below that, an expandable "Testdata" section reveals a JSON object named "root" containing three items: "testString", "testInteger", and a nested object "testProduct" with three items: "name", "size", and "style".
The JSON view of a test data example.

Other Data

In addition to tags, test cases benefit from linking wiki pages of the tested story or the corresponding bug. A common use case is to link an issue in the product’s issue tracker combined with the tag “KnownIssue”. It not only lets the reviewer know that the test case failed due to a known issue but also adds the link to the exact defect.


A portion of a test automation report. At the top, a test result is marked as "Broken." Below that, details of the failure are provided, including the error message "Container startup failed for image selenium/standalo." The report also shows a blue tag labeled "KnownIssue" and a section for "Links" which contains a link to "CCHT-317."
The reviewer can immediately find a link to the related bug.

In our reports, we use the @Link annotation provided by the Allure. You can add three different types of links to the report: a standard web link, a link to an issue in the product’s issue tracker, and a link to the test description in the test management system (TMS).

In addition to being able to add a standard web link to your test cases with the @Link annotation, we implemented a feature in Neodymium that automatically adds the corresponding link of the website to the respective step. In long test flows, this makes it possible for manual testers to rapidly navigate to the correct page and avoid manually reproducing the problem. Some limits might apply for web applications that don’t support direct links or when a state is required, such as a login, to get there.

Assertions

When using assertions, it’s essential to provide easily understandable error messages. If that’s not the case, the reviewer is going to have a hard time finding the right reason or context.

To improve our assertions, we utilize the because-clause provided by Selenide. It not only improves the readability of the error message but also the readability of the assertion itself for non-technical users because of its sentence-like structure.

If an assertion containing the because-clause fails, the specified error message will be displayed in the report with an explanation of what was expected to fulfill the condition. You can combine that with giving aliases to specific selectors to achieve high-quality assertions.

When comparing JSON data with assertions, we also encountered confusing automatically generated error messages. That’s why we implemented a feature in Neodymium that highlights the exact differences in the compared JSON data and adds them as an attachment to the report. This prevents the reviewer from digging through the JSON files to find the issue that caused the assertion to fail.

A JSON difference display with red color for removed and green for added text.
See the differences in the compared JSON data.

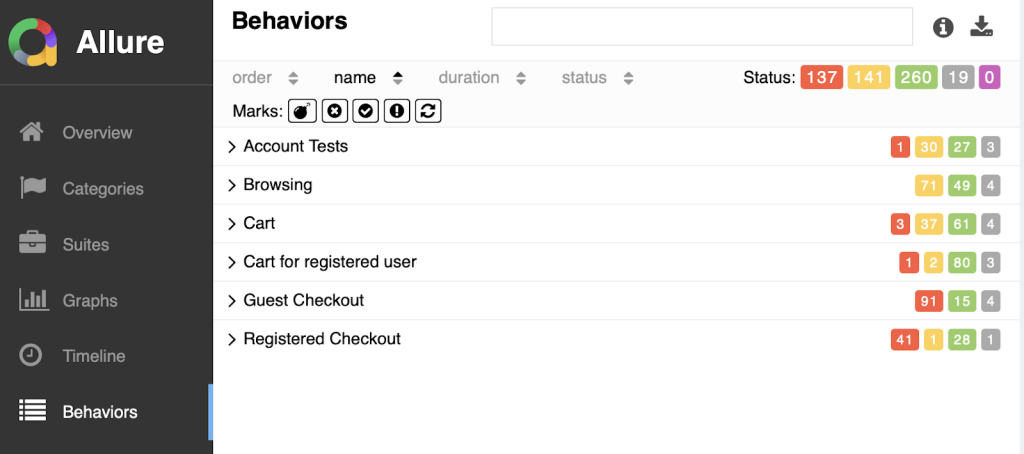
Categories and Groups

When test suites grow, categorization ensures report readability by structuring it into manageable segments. The following features are designed to help with that.

Test Case Grouping

Grouping related test cases makes it easier to navigate the results and identify patterns or trends. If you use Neodymium or just Allure, you can use the @Feature and @Story annotations.


A screenshot of an Allure test report dashboard, specifically the "Behaviors" section. The main panel displays a list of test suites, including "Account Tests," "Browse," "Cart," "Guest Checkout," and "Registered Checkout." Next to each test suite name are columns showing the number of tests with different statuses, color-coded for failed (red), broken (orange), passed (green), and skipped (grey).
An Allure report with tree grouping using @Feature and @Story.

Error Categories

For comprehensive defect management, it’s crucial to have an overview of all issues from the most recent run. This allows reviewers to quickly identify if multiple failed test cases stem from a single underlying defect in the tested system. Additionally, it helps pinpoint the primary error responsible for the majority of test failures.

If you use Neodymium or Allure, you can use the categories file categories.json, which can be found in the test results directory. It is used to define custom defect categories in the form of a JSON array of objects. Each object defines one custom category, and the order of objects in the array is the order in which Allure will try to match the test result against the categories. To define a category, the following properties are used:

  • String name: name of the category
  • String messageRegex: regular expression, the test result’s message should match
  • String traceRegex: regular expression, the test result’s trace should match
  • Array matchedStatuses: array of statuses, the test result should be one of these values: “failed”, “broken”, “passed”, “skipped”, “unknown”
  • boolean flaky: whether the test result should be marked as flaky or not

Allure can also categorize the categories.json automatically based on the exception message, but problems can occur when Selenide and Allure work together. If Selenide takes screenshots on failure, they come with a unique ID which is added to the error messages, leading to unique error messages and errors not being categorized at all. We fixed that in Neodymium by removing the screenshot path from the error messages.

Visuals

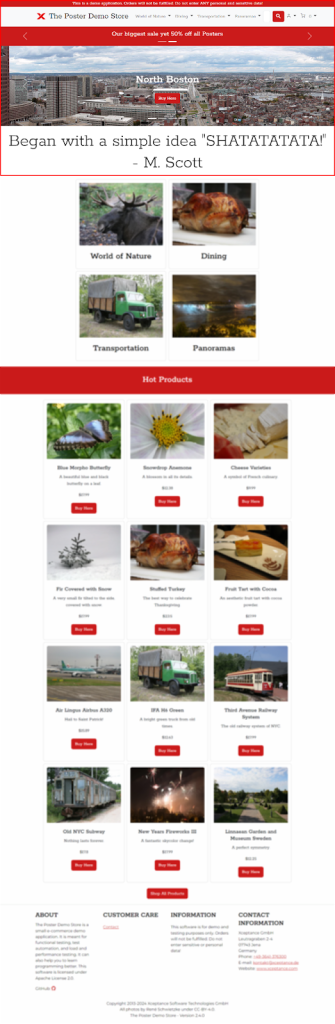
It is important to transform the vast test suite data into easily digestible insights. Visual tools like screenshots or recordings can help with that, making reports more accessible.

Screenshots

To continue making recurring errors reproducible as fast as possible, it makes sense to add a screenshot of the tested website during the error state to the report. With that, the reviewer not only has the stack trace to work with but can also see what exactly went wrong.

Most tools provide screenshots on failure, which is essential for debugging. To see even more details, we improved the already existing Selenide feature by providing the ability to make full-page screenshots in Neodymium. We also added the functionality to highlight the last element and the viewport in the full-page screenshot.

Screenshot of the Posters demo store homepage with a red area highlighted as the portion that was visible.
Fullpage Screenshot (Neodymium)

Video

As an extension to screenshots, it also makes sense to add a video recording of the whole test flow to the report. That enables the reviewer to see how the system reacted and what caused the unexpected behavior, especially when the highlighting of used elements is part of the video. The reviewer can simply follow the steps in the recording, just like a tutorial, to reproduce the error.

In Neodymium, this is part of our standard reporting. If you are interested in this feature, see our documentation on how to set it up in your project.

Summary

Clear and concise test automation reports are essential for efficient results analysis. They are especially valuable when sharing results with non-technical stakeholders. If you have chosen or perhaps will choose Neodymium as your preferred test automation tool, we remain committed to continuously improving its reporting feature to optimize the presentation and understanding of test outcomes, saving you time and effort.

Because Neodymium is open-source under a the MIT license, we invite you to support its development by providing feedback, pull requests, or just writing about it.

Unlock Enhanced Performance Testing: JMeter and XLT

TL;DR: XLT now supports JMeter test suites, offering enhanced debugging, deeper reporting, and cost-effectiveness for JMeter users. It’s open-source and allows you to leverage XLT’s execution and evaluation features with your existing JMX files without vendor lock-in. Simply integrate your .jmx files into the XLT test suite, configure, and run for detailed performance insights.

Are you a JMeter user looking for more robust debugging, deeper insights, and a more streamlined performance testing workflow without abandoning your existing test assets? Do you find other commercial tools like BlazeMeter or OctoPerf to be beyond your budget? If so, we have exciting news! XLT, our powerful load and performance testing tool, now offers dedicated support for JMeter test suites, giving you the best of both worlds.

This integration isn’t about replacing JMeter; it’s about empowering your existing JMX files with XLT’s execution, evaluation, and reporting features. It allows you to protect your investment in JMeter scripts while providing a clear path to leverage XLT’s capabilities, whether you choose to gradually migrate or simply enhance your current JMeter-centric process.

And the best part? Both XLT and this JMeter integration are open source, licensed under the Apache License 2.0. We actively invite you to participate, contribute, and help us make performance testing even better for everyone.

Why Combine JMeter with XLT?

The core idea is simple: continue using JMeter for what it does best – recording, editing, and maintaining your tests. However, when it comes to execution and evaluation, XLT takes over. This seamless handover provides several significant advantages:

  • Enhanced Debugging: Gain crystal-clear insights into executed actions, requests, and responses, making troubleshooting much faster and more efficient.
  • Deeper Reporting: Leverage XLT’s comprehensive reporting capabilities for a more granular understanding of your performance tests.
  • Cost-Effectiveness & Open Source Freedom: Avoid the high costs associated with some commercial performance testing solutions while gaining enterprise-grade features. Being open source means transparency, flexibility, and no vendor lock-in.
  • Protect Your Investment: Your existing .jmx files remain valuable and fully usable within the XLT ecosystem.
  • Flexible Migration Path: You can continue developing in JMeter and execute with XLT, or gradually transition more logic into XLT over time as your needs evolve.

Getting Started

To get started, you’ll need a few prerequisites and then follow a straightforward process.

Requirements

  • Java Version 21
  • An existing .jmx file for test execution (created with JMeter).

Tip: You can find several example JMX files in <testsuite>/config/data/jmeter.

How To Use

  1. Clone the test suite: Get the dedicated XLT JMeter support test suite from its repository.
  2. Prepare your test plan: Build a new JMeter test plan or use an existing .jmx file.
  3. Save your .jmx file: Place your .jmx file into the <testsuite>/config/data/jmeter directory.
  4. Open in your IDE: Import the XLT test suite into your preferred Java IDE.
  5. Locate your file: Confirm your .jmx file is visible under config/data/jmeter.
  6. Integrate your test: Go to src/main/java/com/xceptance/loadtest/jmeter/tests and add your test.
  7. Map your test case(s): Add your new test case(s) to the XLT test case mapping.
  8. Configure active tests: Include your test case(s) in the list of active test cases within your test configuration.
  9. Run and review: Save and run your test. You’ll find the detailed browser results in <testsuite>/results.

This is an example of the simplest JUnit test case required to run a JMeter test with XLT.

Important Considerations

To get the most out of this integration, keep these points in mind:

  • Naming Conventions: Always provide meaningful names for thread groups, transactions, and requests in JMeter. These names directly translate to clearer reports in XLT. If no names are provided, XLT will generate default names.
  • One JMeter File Per Test Case: For optimal reporting and management, treat each .jmx file as a single test case in XLT and limit it to one thread group. 
  • Transaction Controllers & Reporting:
    • Transaction Controllers in your .jmx file will be listed as “Actions” in the XLT report.
    • If “Generate parent sample” is selected for a Transaction Controller, all requests under it will be grouped. If disabled, requests will be listed individually.
  • JMeter Dependencies: upgrade.properties, saveservice.properties, and jmeter.properties are taken from the default JMeter setup. If you have custom values, add these files under your created site.

Supported JMeter Functionality

The XLT JMeter integration offers broad support for common JMeter elements because it uses JMeter under the hood. We have not built an interpreter of JMX files, we put the JMeter engine into the test suite. Behind the scenes, we redirect the traffic to our HttpClient, capture the measured data, and control the traffic using the means of XLT.

  • Thread Group: While JMeter defines them, XLT handles thread management (loops, ramp-up, users) via XTC and properties. All thread groups in one .jmx file are executed sequentially (though one active thread group per .jmx is recommended for clarity).
  • HTTP Request: Supports simple HTTP requests and HTTP multipart.
  • Pre-Processors: Fully implemented as in JMeter.
  • Assertions: JMeter’s assertion checkers are implemented and trigger events in XLT. XLT also supports JMeter’s “continue” (events only) and “stop” functions (affecting ResultBrowser and errors).
  • Post-Processors: Fully implemented as in JMeter.
  • Loop Controller: Works with its internal counter.
  • While Controller: Works with its internal counter.
  • CSV Data: Supported. Place .csv files in <testsuite>/config/data/jmeter/data. Dynamic path resolution from JMeter is also supported by placing the file in the same folder as the .jmx file.

Limitations

While powerful, there are a few limitations to be aware of:

  • XPath2 Assertions: Not yet supported.
  • Load Configuration: Load test configurations (like ramp-up, users, duration) are not read from the JMeter file. These are managed the classical XLT way via property files. Think times and load are controlled by XLT.
  • Multiple Thread Groups: It is strongly recommended to have only one active thread group per scenario (.jmx file) for clearer reporting and separation into independent test scenarios.

The test suite is also a work in progress. Consider it in beta. We’re actively looking for your feedback, contributions, and suggestions.

Ready to Supercharge Your JMeter Tests?

This new integration provides a flexible and powerful way to elevate your performance testing. By combining the familiarity of JMeter with the advanced capabilities of XLT, you can achieve deeper insights, streamline your workflows, and conduct more effective load tests, all while protecting your existing investments.

As an open-source project under the Apache License, we encourage you to try it out, test it, and even contribute! Your feedback and participation are invaluable as we continue to develop and enhance this powerful integration.

Give it a try and discover how XLT can supercharge your JMeter performance testing today!

Links and Resources

The Delicate Art of Load Test Scripting

TL;DR: We are often asked why we need that much time to recheck load test scripts. So, here is our explanation in ten sentences or less.

“Why is the script broken? We haven’t changed anything?” A load test script can be broken in two ways. It breaks clearly, hitting you with an exception or assertion and giving you explicit errors. It’s just incorrect when it appears to pass but is subtly flawed, leading to misleading results.

“But we haven’t changed anything in the UI!” Load test scripts don’t magically adjust. You can’t assume load testing is UI automation on steroids because UI tests are resource-heavy due to our modern browsers. That makes the tests inefficient and costly for simulating many users, whereas load tests use lightweight, lower-level simulations designed for true scale.

“So, where did this change occur?” Scripts break due to changes in HTML/CSS, JSON, required data, or application flow, while they become incorrect because of optional data changes, wrong requests/order, or outdated data.

The secret to lower script maintenance lies in communicating changes with your performance testers early and in validating all data. The less vague an API is, the easier it is to keep the scripts up to date. This way, you’ll ensure your load tests are a true reflection of reality, not just a green checkmark!

Introduction

It’s a question that echoes through many development teams: ‘Why do we need to touch the load test scripts? We haven’t changed a thing on the UI!’ This common query stems from a perfectly logical assumption – if the user interface looks the same, surely everything behind it is too, right? Unfortunately, in the complex world of modern applications, what you see isn’t always what you get, and a static UI can hide a whirlwind of activity that directly impacts your performance tests.

Let’s talk first about what can really mess up your load testing scripts. It’s super important to know the difference between a script that’s completely broken and one that’s just plain incorrect.

  • Broken scripts: These are the ones that just won’t run through at all. If it’s a JUnit test, for example, you’ll see a big fat failure message. It’s dead in the water.
  • Incorrect scripts: These are trickier. They’ll actually run all the way through and show a “green” result, but they haven’t done what they were supposed to. They’re silently misleading you, and they are the main reason why load test script validation isn’t just run and tell based on outcome.

Test Automation vs. Performance Tests: Not the Same Thing!

Because people often mix these up and assume that a load test script is as easily maintainable as a test automation script, here are the key differences.

  • Test automation is usually about checking if something works. Think of it as replacing manual testing or extending its reach so you can get feedback faster. These tests are often UI-based and interact with a real browser or an app.
  • Performance/Load Tests, on the other hand, are about simulating how users behave, but at a much lower level than the UI. This lets you directly control things like the type of calls, data, and even filtering. You also get rid of a direct dependency on a real browser.

Now, you might think, “Why not just scale up my UI automation tests?” Good question! But here’s why that typically doesn’t work.

Modern browsers are hardware hogs. They need multiple CPUs, 512 MB or more memory, and often a GPU just to run smoothly. Trying to run huge tests with actual browsers chews up too many resources, making it expensive and unreliable to test higher traffic.

Illustration comparing resource-intensive web browsers to efficient load testing simulations.
Illustration: Browsers at Scale vs Load Test Simulation

Plus, running a UI test at scale would be a massive waste. You’d be rendering the same UI a million times over without learning anything new about performance. Browsers are also a pain to control remotely, especially when you need to filter or tweak requests to hit (or avoid) certain resources. That filtering can lead to all sorts of problems because of JavaScript dependencies or rendering quirks when third-party calls are skipped during a load test. And frankly, browsers are terrible at telling you when they’re truly ‘ready’ because so much is happening asynchronously. Modern websites are almost never silent, always doing something in the background, making that “ready” state even harder to pin down.

So, to sum it up: performance test scripts are not test automation scripts. The latter are typically UI-based, work at a higher level, and aren’t as sensitive to the nitty-gritty, low-level changes like more or fewer requests, or little parameter tweaks. Performance scripts live in that nitty-gritty world.

What Makes a Script Break?

These are the things that will make your script crash and burn:

  • HTML Changes: Your CSS selectors or XPath expressions suddenly don’t work because the HTML changed.
  • Required Data Changes: The data you have to submit has changed, and your script isn’t sending the correct stuff.
  • Flow Changes: The application’s flow changed (like a checkout process becoming shorter or longer), and your script can’t follow it any longer.
  • Invalid Test Data: You’re using test data that’s just plain wrong, and the system can’t handle it at all.

What Makes a Script Incorrect?

These are the sneaky ones that run but give you bad intel:

  • Optional Data Changes: The data you can submit has changed. The script runs, but it’s not truly reflecting real user behavior.
  • Extra/Missing Requests: Your script is sending requests it shouldn’t, or missing requests it should be sending.
  • Wrong Order of Calls: The calls are happening, but not in the sequence they would in a real user journey.
  • Invalid Test Data: The data is technically valid, but no longer represents the state of the system. Because there is not enough validation in the system under test, things don’t break but rather go unnoticed.

Of course, these are all just examples. While a JSON format change might break scripts for you, it might just lead to incorrect testing for someone else.

How to Keep Your Scripts from Going Haywire

To avoid this constant headache between your scripts and the actual application, you need to bake script maintenance right into your development process. The biggest help here is communication. If performance testers know about feature changes, they can figure out what needs to be done. This means less scrambling to review every script all the time.

Here’s how to tackle those changes:

  • Talk About Changes: Especially when the front-end will see new or removed requests, logic updates, or changes to the data being collected or sent. Keep performance testers in the loop!
  • Disable Old Functionality: When something’s removed from the front-end, make sure to disable it to make it impossible to work. This will make your scripts fail if they try to hit old endpoints, which is a good thing – it forces you to update the scripts.
  • Verify All Required Data: Always verify all the data needed for an action; don’t just leave things optional. This doesn’t just help your performance tests; it also boosts functional quality and security.

Or in English: Every change of the UI for already performance test scripted functionality should yield to a breaking script state. This requires the performance tester to validate things carefully and the application engineer to apply boundaries to the application that communicate clearly what is needed or not desired.

And yes, it is still possible that you cannot set these clear boundaries because the application itself might not know about certain states, or the APIs are not yours so you depend on their overflexibility.

Conclusion

Load testing scripts are different from normal automation, with unique requirements for creation and maintenance. Recognizing the fundamental differences between “broken” and “incorrect” scripts, and between performance testing and UI automation, is vital for achieving accurate and reliable performance insights. By integrating script maintenance into the development process through proactive communication and robust practices, teams can ensure their performance tests remain effective, reflecting the true state of their application under load.

So, there you have it. Load testing scripts are a different beast, and understanding their quirks is key to getting good performance insights. Keep these points in mind, and you’ll be much better equipped to handle them.

P.S. There is an option to run sensible but still resource-intensive load tests with XLT: It supports load testing with real browsers at scale. This is perfect for a blend of test automation and load testing. Of course, you likely are not going for hundreds of users, but rather a small set for a regression and sanity check. First line of defense, so to speak.

P.S. Depending on the framework and concepts you use, going headless with your application probably means a significant increase in scripting effort.

Automated Accessibility Testing with Google Lighthouse and Neodymium

TL;DR: Accessibility is a crucial aspect of web development that ensures everyone, regardless of their abilities, can access and use your website. Web Content Accessibility Guidelines (WCAG) provide a standard for web accessibility, and adhering to them is not only ethically important but also increasingly becoming a legal requirement.

One valuable tool for checking WCAG compliance is Google Lighthouse. It can help identify accessibility issues during development. And when integrated into your test automation project with tools like Neodymium, it can significantly streamline your accessibility testing and monitoring process.

What is WCAG and Why is it Important?

WCAG, or Web Content Accessibility Guidelines, are a set of standards developed to make web content more accessible to people with disabilities. These guidelines cover a wide range of disabilities, including visual, auditory, motor, and cognitive impairments. By following WCAG, you ensure that your website is usable by a larger audience. Approximately 15% of the world’s population has some form of disability.

WCAG compliance is also gaining traction legally, with governments in the US and EU enforcing accessibility standards. Non-compliance can lead to lawsuits and of course to less revenue and visitors.

The Role of Test Automation

Automating WCAG checks using tools like Lighthouse can help find and fix accessibility flaws early in the development cycle, saving time and resources. It also reduces the burden on manual testers by automatically generating accessibility reports.

Most importantly, test automation maintains the achieved level of accessibility of the application through regression testing.

If you have an existing or planned test automation project, it is crucial to incorporate WCAG compliance into your testing strategy. This is why we have integrated Lighthouse into Neodymium, allowing you to easily extend your test cases with accessibility checks.

Continue reading Automated Accessibility Testing with Google Lighthouse and Neodymium

WCAG Testing in E-Commerce: Compliance, Accessibility, and Business Impact

TL;DR: The EU’s upcoming legislation makes WCAG (Web Content Accessibility Guidelines) compliance non-negotiable. With 87 million EU citizens living with disabilities, accessibility isn’t just ethical—it’s smart business. Xceptance, as experts in testing, offers comprehensive WCAG testing to help businesses meet legal requirements while improving user experience and inclusivity. Compliance isn’t just about avoiding fines—it’s about embracing inclusivity, enhancing user trust, and unlocking new market potential.

The Growing Need

Digital accessibility is no longer a nice-to-have — it’s a fundamental necessity. The European Commission estimates that over 87 million people in the EU experience some form of disability – that’s nearly 20% of the population. In Germany alone, that number translates to roughly 7.8 million individuals with severe disabilities. These numbers highlight the importance of making websites, apps, and digital services accessible to all users. The European Accessibility Act (EAA), which will come into effect in June 2025, mandates that e-commerce businesses comply with WCAG 2.2 Level AA standards. This means that online stores, banking services, and digital platforms must remove barriers that hinder people with disabilities from using their services. Non-compliance doesn’t just mean legal repercussions — it risks alienating a significant customer base and damaging brand reputation.

Challenges in E-Commerce

E-commerce businesses face unique challenges in ensuring accessibility compliance:

  • Complex User Interfaces: Online shops often use dynamic elements, pop-ups, carousels, and multimedia content, which can be difficult for assistive technologies to interpret.
  • Checkout and Payment Issues: Forms, captchas, and payment gateways must be accessible to users relying on screen readers or keyboard navigation.
  • Mobile Responsiveness: Accessibility must be maintained across devices, including smartphones and tablets.
  • SEO and Usability Overlap: Many accessibility improvements, such as proper heading structures and alt text, also enhance SEO and user experience.

Without structured WCAG testing, businesses risk excluding a significant customer base and facing compliance issues.

Xceptance: Your Partner in WCAG Compliance

Xceptance specializes in comprehensive software testing, including in-depth WCAG compliance verification. We go beyond simply checking boxes; we empower you to create an inclusive and user-friendly experience.

  • Automated and Manual Testing: We use automated tools to identify accessibility gaps and complement this with manual testing by experts using screen readers and keyboard navigation.
  • Evaluation Against WCAG 2.2 Guidelines: Our tests cover perceivability, operability, understandability, and robustness, ensuring compliance with Level AA standards.
  • Real-User Simulations: We test e-commerce platforms with real users to gain real-world insights into accessibility challenges.
  • Detailed Reporting and Actionable Recommendations: We provide clear, structured reports outlining issues, their impact, and practical solutions.
  • Ongoing Compliance Support: Accessibility is an ongoing process. We help businesses continuously monitor and improve their accessibility standards.

Business Benefits Beyond Compliance

Accessibility isn’t just about checking a legal box—it’s a competitive advantage:

  • Expand Your Customer Base: An accessible site welcomes millions of potential customers.
  • SEO Boost: Many accessibility best practices align with improved search engine rankings.
  • Stronger Brand Trust: Inclusive brands build deeper connections and customer loyalty.
  • Future-Proof Your Business: Early compliance with WCAG standards means staying ahead of regulations and market shifts.

Don’t Wait – Embrace Accessibility Today

The 2025 WCAG compliance deadline is fast approaching. Xceptance provides the expertise and support you need to ensure your online store meets the legal requirements and delivers an exceptional experience for every user.

Ready to unlock the full potential of an accessible e-commerce platform? Contact Xceptance today for a consultation.

A visual call to action for web accessibility, featuring the text "Embrace Accessibility Today" in a dynamic and eye-catching design.

Neodymium 5.1 – Get more done faster

TL;DR: Neodymium 5.1 has been released with a host of impressive new features. These include full-page screenshots in reports, enhanced control over JSON assertions, accessibility testing via Google Lighthouse, and simplified session handling and URL validation.

The newest enhancements primarily focus on these key areas to boost testing efficiency and user experience.

Enhanced Reporting: We’ve significantly improved the quality and usability of test reports. You now get more informative and insightful results with features like full-page screenshots, enhanced JSON assertions for easier data comparison, and a streamlined report structure for improved readability.

Accessibility Testing: Recognizing the growing importance of web accessibility, we’ve integrated Google Lighthouse to automate accessibility checks. This allows you to easily identify and address accessibility issues within your web applications, ensuring compliance with WCAG standards.

Streamlined Workflows: We’ve introduced several features to streamline your testing processes. These include improved session handling for cleaner test environments, enhanced configuration options for greater flexibility, and robust URL validation to prevent unintended access to sensitive systems and ensure test stability.

These improvements are all about making your testing smoother and more dependable. You’ll get better results and learn more from them, so you can build even better software! So, let’s get into the details, shall we?

Continue reading Neodymium 5.1 – Get more done faster

A new magnetic force: Neodymium 5.0.0

TL;DR: We proudly announce the release of Neodymium 5.0.0. Neo is a Java-based test library for web automation that utilizes existing libraries (Selenide, WebDriver, Allure, JUnit, Maven) and concepts (localization, test multiplication, page objects) and adds missing components such as test data handling, starter templates, multi-device handling, and other small but useful everyday helpers.

Our R&D team has been busy brewing! So today we finally get back on the major release train and present you the new Neodymium 5.0.0. It comes with a lot of new little convenience features, giving you more control and possibilities on your test automation. A better browser control, improved configuration possibilities and a bunch of new annotations like @DataItem, @WorkInProgress, @RandomBrowser, will help you set up and configure your test automation to your specific needs. Even if a picture says more than 1000 words sometimes it’s a pain to see on a single screenshot, why the automation journey broke, to help you in such cases, we introduced video recording, to exactly see what happened during the whole user journey.

See below for what you can find inside the big box of updated code:

Continue reading A new magnetic force: Neodymium 5.0.0

Xceptance Supports Young Explorers with Donation to Witelo e.V.

The little Ozobot speeds around the corner, flashing colorfully, winds its way along a spiral, collides briefly with one of its colleagues and finally finds its way through the maze. It is navigated to its destination by color sensors on its underside, which allow it to follow a defined route. The miniature robot was not programmed by a high-tech engineer, but by Magnus, 10 years old, and the son of our co-founder Simone Drill.

During a programming workshop, he learned to give commands to the Ozobot and to control it with the help of color codes.  This was made possible by witelo e.V. from Jena, who offer working groups and experimentation courses at schools, as well as extracurricular learning formats. These scientific and technical learning venues were founded to promote so-called STEM education, with computer science as one of its components. Students learn the basics about coding, robotics and algorithms in research clubs, on hands-on days and during a wide range of vacation activities. In this context, Magnus also had the opportunity to playfully gain his first programming experience and took his enthusiasm from the workshop home with him.

Source: Ozobot
Continue reading Xceptance Supports Young Explorers with Donation to Witelo e.V.

Data Science Day 2022

After a two-year break, on 18 May 2022, the 4th Data Science Day Jena took place. The Friedrich-Schiller University is hosting this mini-conference format annually.

Xceptance presented this year a closer look at the data that is collected and processed during load and performance testing. René Schwietzke, Managing Director of Xceptance, talked about the challenges to capture the right data as well as translate the collected data into meaningful results. 

A load test simulates millions of user interactions with a website and therefore is capturing huge amounts of data points. These have to be transformed into a few numbers to make the result of the test easy to communicate but still preserve important details. The talk started with typical business requirements and expectations of the target groups of a load test. It showed the data XLT captures and the dimensions which later drive the data reduction. A few example data series demonstrated the challenges behind the data reduction and what numbers are finally used to satisfy the requirements.

An example load test result illustrated the talk with real data. That example test run created about 17,500 data rows per second which contain about 293,000 data points. The entire test result consists of 3.2 billion data points. This massive data set is turned into a consumable report by XLT in less than six minutes. 

For everyone with an interest in data science, this presentation also offers ideas for research in regard to unsolved data challenges. There might be even some Master’s and Bachelor’s theses topics waiting for you. 

You can find a recording of the presentation below (courtesy of Thüringer Universitäts- und Landesbibliothek Jena).

This is the accompanying slide deck. It is a Reveal.js-based. You can navigate with the spacebar and the arrow keys.

Picture of the presentation


2020 – One Year, One Picture

One Picture Says It All

If we can only use one picture to symbolize 2020, this might just be it. Working from home and video conferences are now the new normal.

Happy Holidays, Merry Christmas, and a Happy and Healthy 2021, because we all need that.