Because we encountered another hidden encoding issue as part of test data, here are some information about BOM and why this might be interesting in general for everyone working with a computer beyond Excel and Word.
Before you educate yourself, here is the tool to own to see such a problem easily. Most of all editors hide that information and so you might scratch your head why some data is failing with strange error messages. Get xxd and you will see with other eyes:
Xceptance released version 4.11 of its load testing and test automation product Xceptance LoadTest. This is a feature release. We recommend upgrading to this newest version.
Here is a selection of the most important changes:
HtmlUnit and Selenium have been updated
You can run a test case with only a single data set at development time
XLT picks a data set automatically when a test with multiple data sets is part of a load test
There is a new command-line tool to automatically evaluate a test report based on your defined success criteria
The XLT Jenkins plugin returns a result object now with all the details when used in a pipeline
The XLT Jenkins plugin can now create a comparison report
See our release notes for more details. As always, this upgrade is free and don’t forget, XLT itself is free as well. You don’t have an excuse to skip performance testing or rely on lame simple test cases anymore.
Xceptance released version 4.3 of its load testing and test automation product Xceptance LoadTest. It features a wide range of improvements and new functionality.
As always, this update is free of charge for every user. You can use XLT freely for your daily automation work, regression testing, and performance validation. If you are an eligible Open Source project, you can get a full XLT license for your load and performance testing needs for free as well.
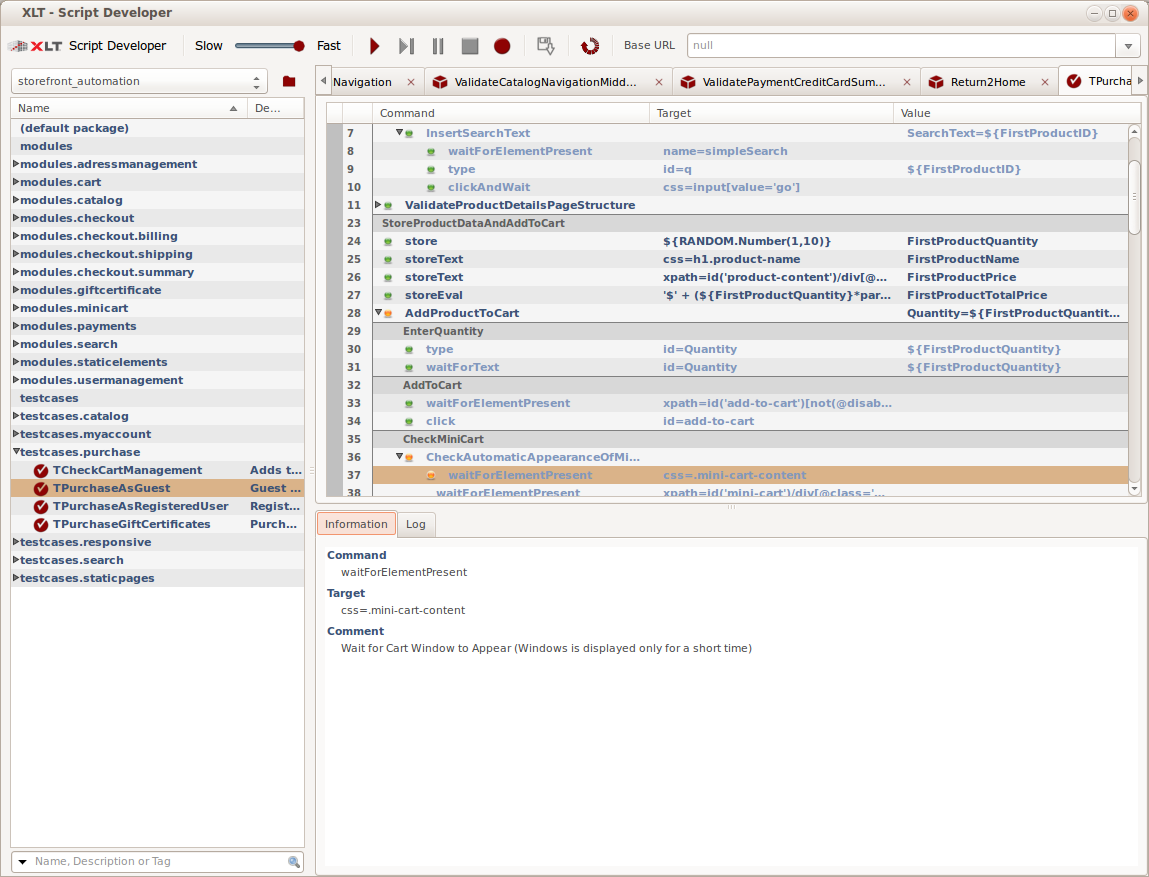
Script Developer
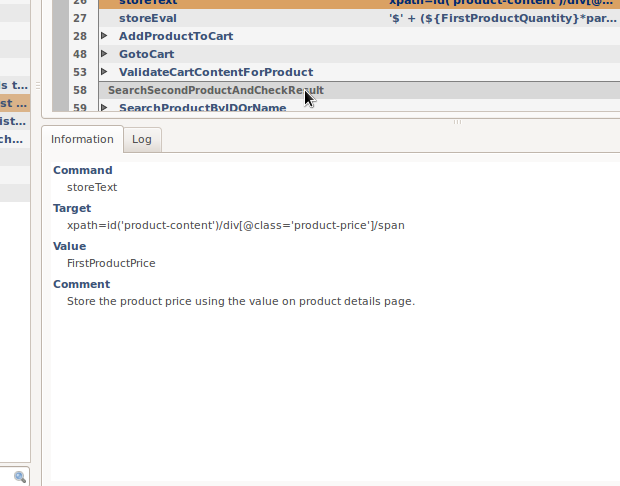
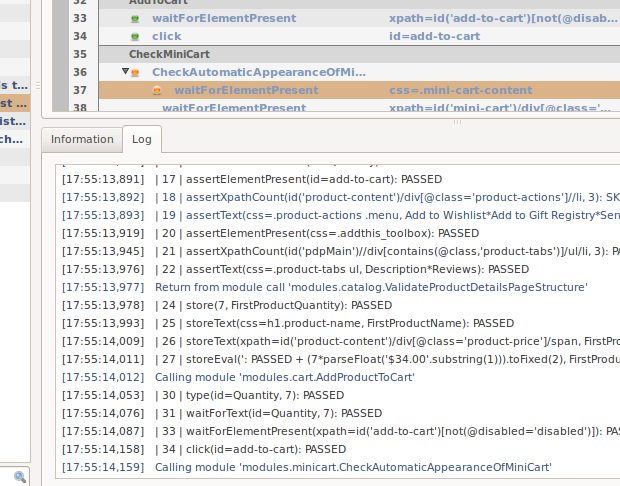
Enjoy more automation with less clicking. The new information panel summarizes the specifics of the currently selected item, so you do not need to open it anymore. Additionally, the new log panel lists all executed commands and their respective parameters.
XLT Script Developer
The new Information Panel
The new Log Panel
If an element is styled with the CSS property text-transform, then the element’s text on the screen may have different character casing from what is defined in the page’s DOM tree. The WebDriver specification mandates to return the text as shown on the screen. Script Developer will now record text with the the character casing that appears on the screen and it will also take the CSS property text-transform into account when replaying text assertions.
Reporting
The XLT load test reports have been improved by adding more charts and data details, such as overall statistics for all timers. Arrival rate charts have been added to visualize the load development over time and make sure the desired load factor was reached.
Charts can now optionally be configured to be logarithmic. A capping can be added to hide larger spikes, which usually make charts hard to read, without removing the important information altogether.
Standard Chart
Chart with Cap
Logarithmic Chart
The new networking section summarizes all general network-related statistics and charts on a separate page.
The error and event page has been redesigned and includes a new error chart that contains separate graphs for all transactions/actions/requests so that the temporal distribution of transaction/action/request errors is displayed in one chart. A new error summary table groups all errors by their error message to help you see which types of errors occurred and how many of them.
Load and Performance Testing
The master controller features two new commands to validate the availability of agents and display their current configuration. A new command line option permits the skipping of result downloads when XLT is used as a load generator only.
Framework Extensions
A set of new commands is available in Script Developer and in the framework: commands such as assertAttribute, assertStyle, assertClass, assertEval, and their matching store and wait equivalents.
XLT can now send and receive IDs as part of the request to ease the correlation of server-side logs and test results. XLT may send a randomly generated alphanumeric ID as request header or extract such an ID from an arbitrary response header.
When dealing with different test environments, different load profiles, and/or different test data at the same time, managing different combinations of configuration settings can be challenging. The new property file include feature makes it easier now to predefine aspects and reuse them later in different configurations without copying and pasting.
When a test case reads a certain setting from the configuration, the framework uses a fallback strategy when doing the property look-up. This strategy performs an additional look-up step now, based on the transaction name (the short name to which the full class name is mapped). This additional step lets you parameterize different transactions differently, even if they are mapped to the same class and therefore share the same code.
The webdriver that will be used when executing functional tests can now be configured via properties. This allows greater flexibility and hardcoding is not necessary anymore.
When XLT executes XML script test cases with a WebDriver instance that is capable of taking screenshots, it can take a screenshot after each action, if desired.
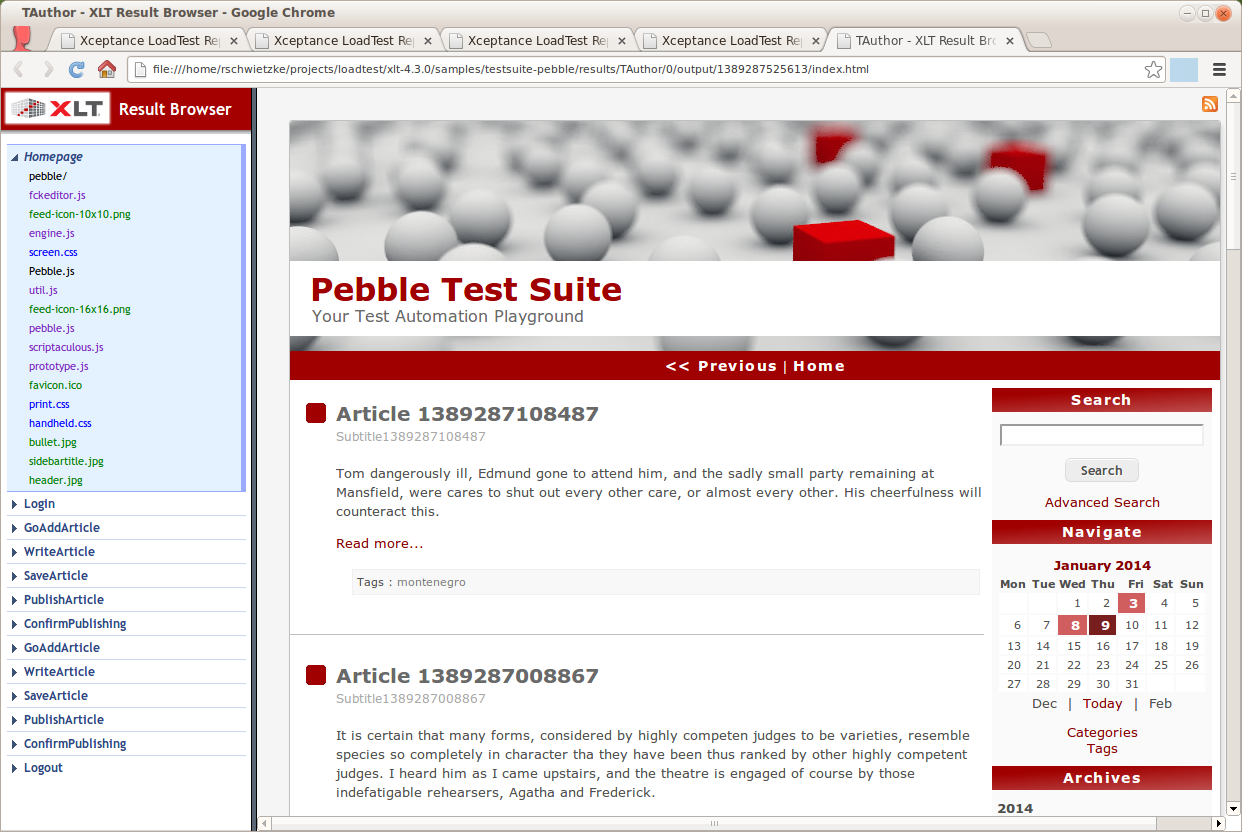
Result Browser
A new look matches the overall styling of reports. Also, the navigation bar can now be resized, requests are color coded to visualize the content type, and the first page is displayed automatically. URLs are now active links, so you can click them easily.
If needed, the content of a response can be beautified for certain content types (HTML, JavaScript, JSON, CSS). This includes formatting and syntax highlighting.
Misc
XLT is shipped with an empty test suite project that can be used as a template for your own projects.
HtmlUnit has been upgraded to version 2.12.
WebDriver/Selenium has been upgraded to version 2.39.0.
EC2 admin console permits setting a tag name now.
Amazon Machine Images
The Amazon Machine Images (AMI) listed below are available for public use. Using these images is free of charge, but require that you own an Amazon Web Services (AWS) account. Please make sure that your EC2 security group permits communication on port tcp/8500. AMIs with Java 6 are no longer provided.
eu-west-1 : ami-ceae46b9
us-east-1 : ami-2510394c
us-west-1 : ami-e4ccfca1
us-west-2 : ami-9ebadeae
ap-southeast-2 : ami-617be45b
If you need XLT-AMIs in Tokyo, Singapore, or Sao Paulo, please let us know.
Purchase Licenses and Support Online
Licenses and support can be conveniently ordered through our XLT Self Service Center. You can instantly download licenses and purchase support right when it is needed. All your invoices and previous licenses (when purchased online) are accessible at any time.
We will notify you before your license or support runs out, so that you will never miss that again. This enables you to continue your daily automation and load testing work without interruption. Please note that we do not renew your contracts automatically, so no strings attached.
Visa and MasterCard are accepted. All credit card data is processed and secured by Wirecard.
Are you familiar with someone asking you to do things such as putting all of your clients into the new CRM or inserting 80 new users in a software product x? If so and if your software has no import feature, you probably found yourself copying and pasting all day long. A simple way to save you from this torture is using a UI automation tool like Sikuli Script.
What is Sikuli?
Sikuli automates UI functionalities like mouse, keyboard, and clipboard actions. It works with UI recognition to identify UI components such as buttons, input fields, or menus. To use this kind of recognition, Sikuli compares the actual screen with screenshots from the user. Continue reading Simplify Your Life With a Little UI Automation→
Powerful load and performance test tools don’t only retrieve pages of your website randomly with zillions of users at the same time, but they also cover realistic scenarios simulating the real-world user. It’s a given that they can deliver lots of useful information and plot interesting charts. To fully take advantage of these benefits, however, you need to be able to interpret this information and draw the right conclusions.
It is this need for the correct interpretation of test results, the mapping of all you see against actual application behavior that makes performance and load testing a non-trivial task. It requires much experience to decide on the right actions, make the right assumptions, or simply come up with a reasonable explanation of why something happened this way and not the other.
In today’s article, we’d like to present you a couple of charts displaying typical response time patterns, and discuss what they could indicate.
Disclaimer: Of course, the reasons for a certain behavior vary a lot, depending on your application and testing. However, as there’s no fixed manual for the interpretation of load testing charts, we want to provide you with a couple of basic guidelines to help you get better in interpreting them yourself and make the most out of your test results. Feel free to comment whether or not you agree with the ideas and explanations we come up with.
The Warm-up
These charts might indicate a system with a cold cache, for instance, when the system has just been started and the caches aren’t filled yet.
The basic characteristics of such a behavior are high response times in the beginning, followed by gradually lower response times until eventually a certain degree of runtime stability is reached. This time frame is often referred to as the system’s warm-up period. Throughout this period, a couple of things can happen under the surface. If you know the system under test well, you’ll probably come up with the following: database and file system caches are filled, proxies learn about the data and store them, the system under test scales up because it sees traffic, page snippets are cached and so the computing overhead reduces… you name it.
Also keep in mind that it might be the testing process itself that causes such a response time profile. If the system is perfectly warmed up and you hit it, your sent traffic might be too uniform in the beginning. That being the case, randomization kicks in so that the traffic eventually distributes better over time. Furthermore, take into consideration that your load software and hardware are possibly not warmed up either.
The Caching
These charts depict either a typical cache clean or job patterns. In case of a cache clean, system-internal caches expire every half hour. If that’s not the case, the charts may indicate a running background job draining power from the database or consuming lots of system bandwidth.
Both charts display the same test; however, this test has been executed for different time periods. While two spikes could signify a random event (despite the fact that the temporal distance of 30 minutes is suspicious), the longer test run seems to prove our first assumption: something is going on every half hour.
In any case, make sure that such a behavior is not produced by the test machines themselves, for example, because they’re busy writing or backing up data.
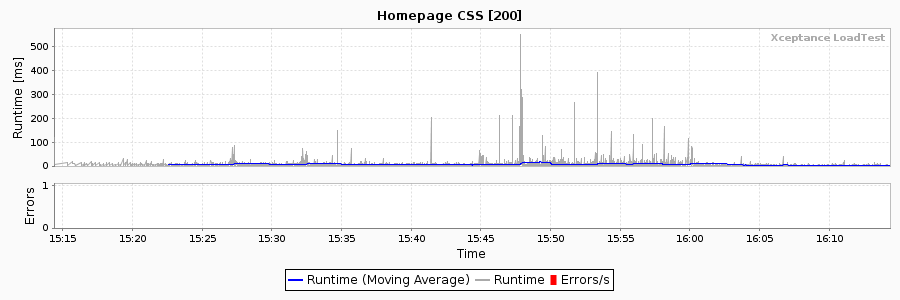
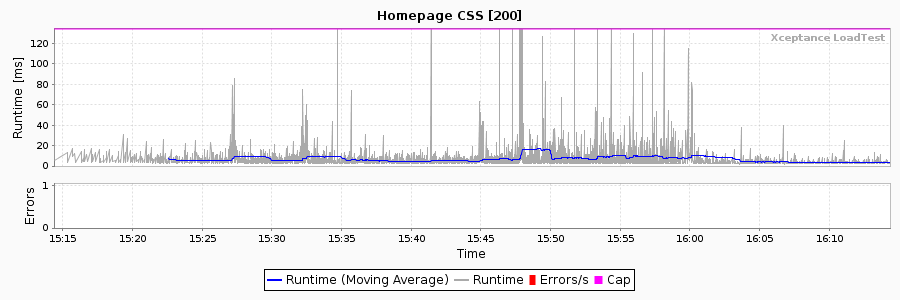
The Spiking
This is what we call a forest of spikes: many spikes that don’t seem to follow a comprehensible pattern; longer runtimes just occur occasionally, often caused by requests accessing certain data or URLs that produce long runtimes. To get behind that mystery, you have to dig into the results in more detail, find the calls behind the spikes, and derive a pattern based on the information you find. Often you’ll come across similar URLs, request parameters, or maybe response codes. Don’t forget any application logs you might have access to, such as web server, error, information, or debug logs. In a perfect world, your application under test offers the necessary tools to get to the bottom of this problem.
XLT lets you easily find this information. All test result data are accessible as CSV files that are quickly readable and documented. Feel free to work with this information and go beyond the scope of the reports available.
The worst outcome here is a non-identifiable pattern and no information on the server side as to what might have happened. In such a case, you have to repeat the test and narrow down your test setup later on to exclude as many variables as possible to find the cause. This is actually also a good time to ask for development or tech-ops support.
The 3rd-party Calls
The first chart is typical for issues with 3rd parties, especially in the field of e-commerce. We’re not talking about direct calls to 3rd parties here, such as analytics vendors or recommendation engines, but calls from one server to the other. Thus, the response time we see is the response time of two systems. Of course, it’s good to know the area where 3rd party calls typically happen, but you have to know the application under test anyway to test it efficiently. So when the final order steps start to act weird, you can easily narrow down the potential reasons.
The second chart looks more like the cache clean or expiration problem described above, but since you know the application, you also know that this area doesn’t use the typical caching logic but is highly dynamic instead. This means that the errors occurring every 50 minutes point into a different direction: as we know that 3rd parties are attached and called during shipping, we can conclude that the 3rd party failed on us.
Verdict
Knowing typical response time patterns helps you specify a certain problem so that you can give hints to the development or further shape the path of testing. If you can read charts and derive the right conclusions or at least know which questions you have to address, you’ll be ahead of the crowd. Be aware that knowledge on the system under test is very important – the production and measurement of a certain load doesn’t make much sense when you’re not able to actually interpret and explain what you’ve measured. Always remember: 42 is not a valid answer for everything. :)
Wir bauen gerade unseren ersten Screencast. Na langer Sucherei fiel unsere Entscheidung auf Wink. Macht sich erstmal ganz gut. Grosser Vorteil ist die Editierbarkeit jedes einzelnen Bilders/Frames.
Vom Eclipse-Projekt gibt es jetzt auch einen Memory-Analyzer. Ich probiere das Ding gleich mal aus. Es soll grosse Hprof-Dumps effizient analysieren können. Das wäre genau richtig, schliesslich quälen wir uns oft mit 1-2 GB Files rum.
Es gibt selten Tools von Microsoft, die mich vom Hocker reissen. Gut, die ganzen Teile von SysInternals sind Klasse, aber schliesslich hat MS diese Firma auch aufgekauft. Richtig gut ist aber auch Fiddler, ein Proxy mit richtig viel Schnickschnack.
Fiddler macht das Leben eines jeden Testers oder Webentwicklers viel einfacher. Wer es nicht glaubt – Ausprobieren!
We use cookies. For more information please read our privacy section. We also use analytics.
By clicking Opt-Out, we will place a non-personalized cookie on your machine that indicates that you don‘t wish to be tracked.