Tag Archives: XLT

Release Xceptance LoadTest 4.2.7

XLT LogoXLT 4.2.7 has been released. It delivers improvements as well as defect fixes. We recommend to upgrade as soon as possible to stay up to date.

Script Developer

  • Fix: Obsolete entries from the base url drop down can be removed now.
  • Improvement: With special characters in the link name, the Script Developer sometimes recorded an XPath locator instead of the more appropriate link locator.

Load Test Environment

  • Fix: Custom samplers stopped working for the rest of the load test when an exception was thrown. Now the sampler continues to run.
  • Fix: The Mastercontroller used a previously entered comment when the current comment was left empty.
  • Improvement: The Mastercontroller returns non-zero exit code for all error conditions now.

Framework

  • Fix: HtmlUnit did not sent the basic HTTP authentication header for follow-up requests correctly, only when challenged again.

Of course, we are providing a set of fresh Amazon Machines Images as well. You can find all information on our product page. Make sure you stay informed by subscribing to our XLT release email list.

WebDrivers in XLT: How to Run Test Cases in Multiple Browsers

Update: Before you continue reading, here is a new version of this test suite and article: Multi-Browser-Suite for Test Automation. It makes things a lot easier.

Have you heard of XLT Script Developer yet? If you have, you’ll probably agree that it’s a convenient tool to record and run automated test cases. However, with it being a Firefox plugin, you’re basically bound to run your test cases in Firefox. Wouldn’t it be nice to reuse Script Developer test cases in multiple browsers? You can actually do so by taking advantage of the WebDriver API that is part of the XLT framework.

If you don’t know much about WebDrivers, you should continue reading this article – the first one of a little article series on WebDrivers that hopefully gives you a good introduction to the topic.
Continue reading WebDrivers in XLT: How to Run Test Cases in Multiple Browsers

The Art of Reading Performance Test Charts

Powerful load and performance test tools don’t only retrieve pages of your website randomly with zillions of users at the same time, but they also cover realistic scenarios simulating the real-world user. It’s a given that they can deliver lots of useful information and plot interesting charts. To fully take advantage of these benefits, however, you need to be able to interpret this information and draw the right conclusions.

It is this need for the correct interpretation of test results, the mapping of all you see against actual application behavior that makes performance and load testing a non-trivial task. It requires much experience to decide on the right actions, make the right assumptions, or simply come up with a reasonable explanation of why something happened this way and not the other.

In today’s article, we’d like to present you a couple of charts displaying typical response time patterns, and discuss what they could indicate.

Disclaimer: Of course, the reasons for a certain behavior vary a lot, depending on your application and testing. However, as there’s no fixed manual for the interpretation of load testing charts, we want to provide you with a couple of basic guidelines to help you get better in interpreting them yourself and make the most out of your test results. Feel free to comment whether or not you agree with the ideas and explanations we come up with.

The Warm-up
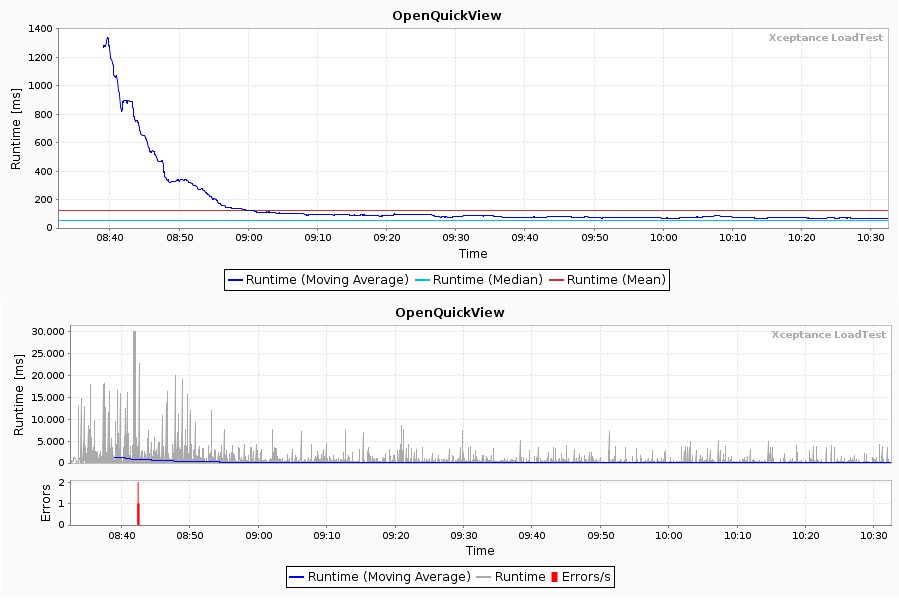
These charts might indicate a system with a cold cache, for instance, when the system has just been started and the caches aren’t filled yet.

The basic characteristics of such a behavior are high response times in the beginning, followed by gradually lower response times until eventually a  certain degree of runtime stability is reached. This time frame is often referred to as the system’s warm-up period. Throughout this period, a couple of things can happen under the surface. If you know the system under test well, you’ll probably come up with the following: database and file system caches are filled, proxies learn about the data and store them, the system under test scales up because it sees traffic, page snippets are cached and so the computing overhead reduces… you name it.

Also keep in mind that it might be the testing process itself that causes such a response time profile. If the system is perfectly warmed up and you hit it, your sent traffic might be too uniform in the beginning. That being the case, randomization kicks in so that the traffic eventually distributes better over time. Furthermore, take into consideration that your load software and hardware are possibly not warmed up either.

The Caching
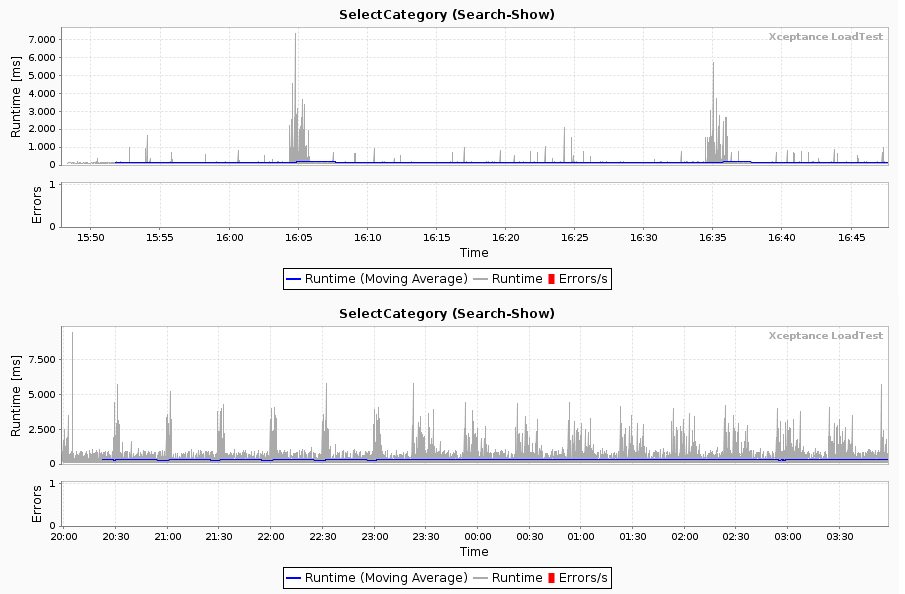
These charts depict either a typical cache clean or job patterns. In case of a cache clean, system-internal caches expire every half hour. If that’s not the case, the charts may indicate  a running background job draining power from the database or consuming lots of system bandwidth.

Both charts display the same test; however, this test has been executed for different time periods. While two spikes could signify a random event (despite the fact that the temporal distance of 30 minutes is suspicious), the longer test run seems to prove our first assumption: something is going on every half hour.

In any case, make sure that such a behavior is not produced by the test machines themselves, for example, because they’re busy writing or backing up data.

The Spiking
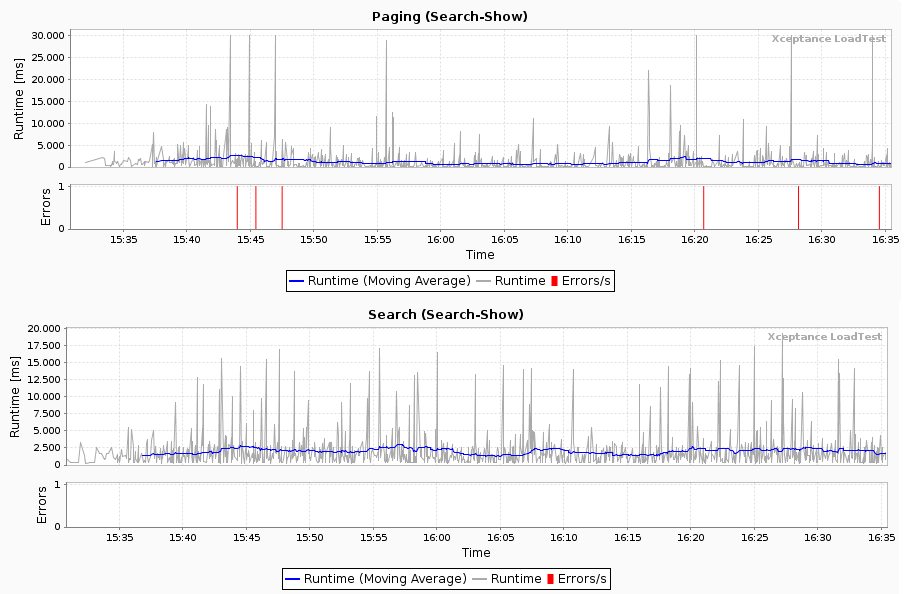
This is what we call a forest of spikes: many spikes that don’t seem to follow a comprehensible pattern; longer runtimes just occur occasionally, often caused by requests accessing certain data or URLs that produce long runtimes. To get behind that mystery, you have to dig into the results in more detail, find the calls behind the spikes, and derive a pattern based on the information you find. Often you’ll come across similar URLs, request parameters, or maybe response codes. Don’t forget any application logs you might have access to, such as web server, error, information, or debug logs. In a perfect world, your application under test offers the necessary tools to get to the bottom of this problem.

XLT lets you easily find this information. All test result data are accessible as CSV files that are quickly readable and documented. Feel free to work with this information and go beyond the scope of the reports available.

The worst outcome here is a non-identifiable pattern and no information on the server side as to what might have happened. In such a case, you have to repeat the test and narrow down your test setup later on to exclude as many variables as possible to find the cause. This is actually also a good time to ask for development or tech-ops support.

The 3rd-party Calls
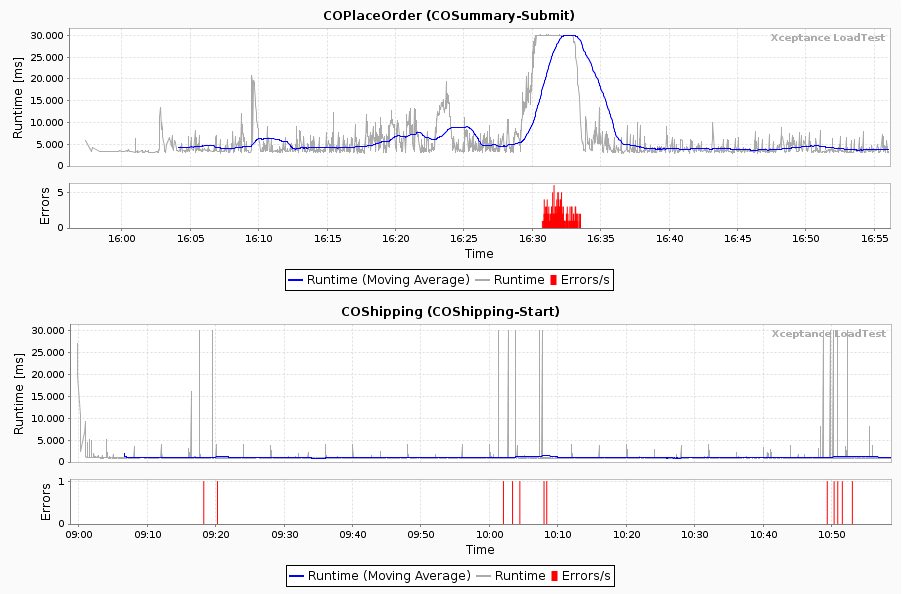
The first chart is typical for issues with 3rd parties, especially in the field of e-commerce. We’re not talking about direct calls to 3rd parties here, such as analytics vendors or recommendation engines, but calls from one server to the other. Thus, the response time we see is the response time of two systems. Of course, it’s good to know the area where 3rd party calls typically happen, but you have to know the application under test anyway to test it efficiently. So when the final order steps start to act weird, you can easily narrow down the potential reasons.

The second chart looks more like the cache clean or expiration problem described above, but since you know the application, you also know that this area doesn’t use the typical caching logic but is highly dynamic instead. This means that the errors occurring every 50 minutes point into a different direction: as we know that 3rd parties are attached and called during shipping, we can conclude that the 3rd party failed on us.

Verdict

Knowing typical response time patterns helps you specify a certain problem so that you can give hints to the development or further shape the path of testing. If you can read charts and derive the right conclusions or at least know which questions you have to address, you’ll be ahead of the crowd. Be aware that knowledge on the system under test is very important – the production and measurement of a certain load doesn’t make much sense when you’re not able to actually interpret and explain what you’ve measured. Always remember: 42 is not a valid answer for everything. :)

XLT 4.3 Preview

We are looking forward to release XLT 4.3 soon. A lot of work has been invested to improve XLT and to provide a much easier way to gather all information from our powerful report engine. Have a look at some of the new features below.

Highlights

New summary statistics directly on the overview page

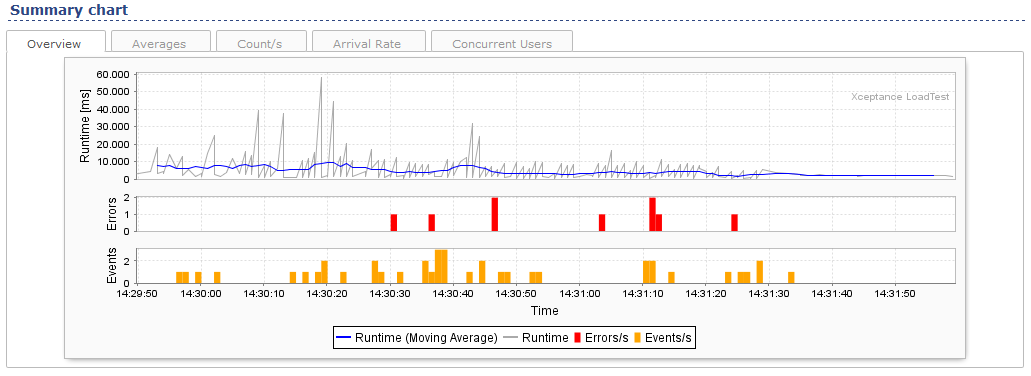
It´s easier than before to get a quick overview of the performance of a system in general. Right on the overview page you will find information about summary statistics calculated over all transactions, actions, requests and custom timers. In addition to these statistics you´ll find a summary graph on the respecting category pages:

Trend reports will also contain summary charts, summary statistics will be available in comparison reports.

Arrival rate charts

We have already explained in detail why using the arrival rate model is best suited to simulate realistic system behavior. It was about time that we are offering dedicated charts to observe the arrival rate of a test run.

New error overview table

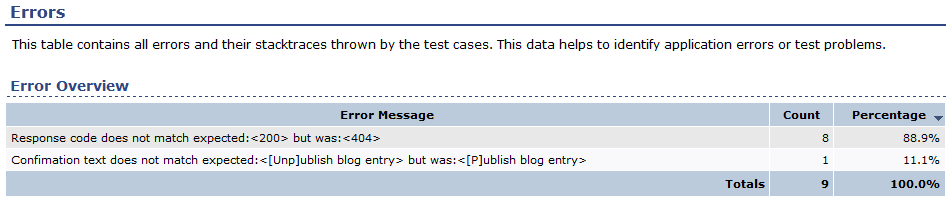
In addition to the detailed error table there will be a brand new reduced overview table which provides a quick overview about occurred errors:

Better readability for charts with high peaks

Charts with peaks (for example, caused by timeouts) can be hard to interpret as the relevant value area is squeezed together. We will offer two ways to improve this:

  • The report generator can produce charts with a logarithmic scale instead of a linear scale.
  • The maximum displayed y-value can be limited to a certain upper value, using a configurable factor multiplied by the mean value.

Both ways can be controlled within XLT settings and can be combined as well.

More report improvements

  • It will be possible to switch to the same chart tab for all shown timers
  • Added sorting feature to certain report tables such as the error and the response code table
  • Overview about all responses grouped by their content type

Under the hood

  • XLT 4.3 will use HtmlUnit v2.11
  • It will be possible to ping agent controllers to briefly check whether all configured agent controllers are alive and run the same version of XLT.
  • Improved error messages
  • Added include feature to configuration files which makes it much easier to create flexible test suite configurations for different environments and with different load profiles.

There are many more improvements and several bugfixes. Stay tuned!

HPQC and XLT – Integration Example

You have to work with HP Quality Center (HPQC), but you don’t want to execute all the test cases manually. You automated some tests using XLT Script Developer and like the outcome. You want to use the Script developer much more but you face one last problem: You still have to enter the test results manually into HPQC. This renders some of the test automation advantages useless.

The following example can mitigate that problem. HPQC offers an API called Quality Center Open Test Architecture API (OTA API).
Using this interface, you can set test results automatically.
Continue reading HPQC and XLT – Integration Example

Availability of Xceptance LoadTest 4.2.0

XLT 4.2.0 delivers a large set of new and improved functionality.

The Script Developer has seen a lot of enhancements. Most noticeably is the support of variables now. You can store data from the web page, run calculations in JavaScript and store the result, and reuse all later. There is now the notion of global and local test data. So any data that applies to multiple test cases at the same time can be managed more easily now. Besides the already mentioned store commands, the Script Developer also permits assertion and wait commands for visibility, select and check boxes, as well as value attributes of an element.

Further usability improvements permit easier switching between projects and the execution of a single command in a test case for faster development. Test cases can now be run directly from the package tree without the need to open them first. The test data management has been completely reworked to simplify and speed up editing of data.

The load test engine supports a fully variable load test profile now. You can define any load pattern you want, such as a 24 hour test with peaks around noon and early afternoon, low traffic during night hours, slow ramp up in the morning and multiple load changes over the course of the day. Additionally the ramp up of arrival rates is now supported as well.

To speed up things and fully utilize the available connectivity, the upload to and the download from agents has been fully parallelized. Optionally you can adjust the desired concurrency. Also the timeout against agents can now be set.

The documentation layout as well as the report design have been redesigned to improve usability, make them visually more pleasant, and unify their appearance. Third party libraries used to deliver enhanced functionality have been upgraded to cover the latest browsers as well as UI trends.

Please see the detailed release notes for more information about new features, enhancements, and defect fixes.

XLT skills are in demand

XLT skills in demandThe German computer magazine c’t recently published the results of their recurring income study among IT personnel.

The hourly rates for knowledge and skills list XLT – Xceptance LoadTest – in second place, right after DB2 and before Windows Embedded.

Yes, we were a little surprised to see XLT skills in such high demand. It encourages and motivates us, because we know that we are on the right track with XLT to deliver an flexible but simple and efficient tool for load and performance testing, as well as regression testing.

What does this mean for you as developer, tester, or IT decider? Get yourself a copy of XLT, take a closer look at it, train your developers, or learn it yourself, because others already have and they are enjoying a competitive advantage.

Source: Zahltag – c’t 06/2012, page 94

Handle authentication during WebDriver testing

Sometimes authentication is necessary before a test case can be executed. While HtmlUnit based tests can easily enter and confirm authentication requests, most browser based tests, cannot workaround the dialog. This is a browser security measure to prevent automated data capture and/or data entering. WebDriver for Firefox delivers a solution for that problem, but IE and Chrome rely on a manual interaction with the browser before the test automation can run.

The following steps describe a solution for the authentication problem and how to run a script test case as WebDriver based test. The key to this solution is the usage of Sikuli, an image based testing tool that directly interacts with the screen to find the right elements by using the screen.
Continue reading Handle authentication during WebDriver testing

Discontinued support of JRuby

The upcoming Xceptance LoadTest 4.2 will discontinue the direct support of JRuby as a programming language for writing test cases. This will not change the way Java and JRuby interact and therefore you can still use all Java components and integrate them into your JRuby-based test suite. You can also still write test cases in Ruby and use XLT-APIs.

You can read about this feature, in case you are not sure whether or not you will be affected by this change: XLT 3.3.0 JRuby support release note.

Version 4.2 of Xceptance LoadTest will not continue the JRuby package anymore (jruby.jar). The test execution scripts for JRuby-based tests and all demo test cases will be removed as well.

If you have any questions regarding this change, please do not hesitate to contact our support team directly.

XLT 4.1.8 Update Release

XLT 4.1.8 has been released. It contains a couple of improvements and bug fixes. You can get the latest version here: https://lab.xceptance.de/releases/xlt/4.1.8/.

These are the two most important changes.

Optimized scanning CSS rules

XLT simulates the download behavior of a browser as close as possible. With com.xceptance.xlt.css.download.images set to onDemand, XLT carefully considers the download of image resources referred to in CSS files. It checks all CSS rules if they apply to all elements in the DOM tree and, if so, extracts the resource information for later download. This process was previously very expensive and ran for up to several seconds when a page was complex and a lot of CSS rules had to be matched. This has been optimized heavily.

Configurable retry behavior for keep-alive connections

If persistent connections (keep-alive) are enabled, test cases might failed sporadically with an exception such as:
java.lang.RuntimeException: org.apache.http.NoHttpResponseException: The target server failed to respond

This exception occurs only when the request was sent while the connection was about to be closed on the server side at the same time.

The underlying HttpClient retries requests if the connection was closed by the server. However, by default it retries only idempotent operations such as GET and HEAD, but not POST and PUT. In order to avoid these connection errors, the user can now configure whether non-idempotent operations are to be retried as well. Common browsers seem to use the same behavior and most certainly assume that the server did not start to process the request when it closes the connection immediately without responding with a proper HTTP status code.

A new boolean property com.xceptance.xlt.http.retry.nonIdempotentRequests in config/default.properties controls whether or not operations such as PUT and POST are retried in case of certain networking problems. Note that idempotent operations are always retried.